29
/
en
AIzaSyAYiBZKx7MnpbEhh9jyipgxe19OcubqV5w
April 1, 2024
159447
Ireland
IRL
true
2
1
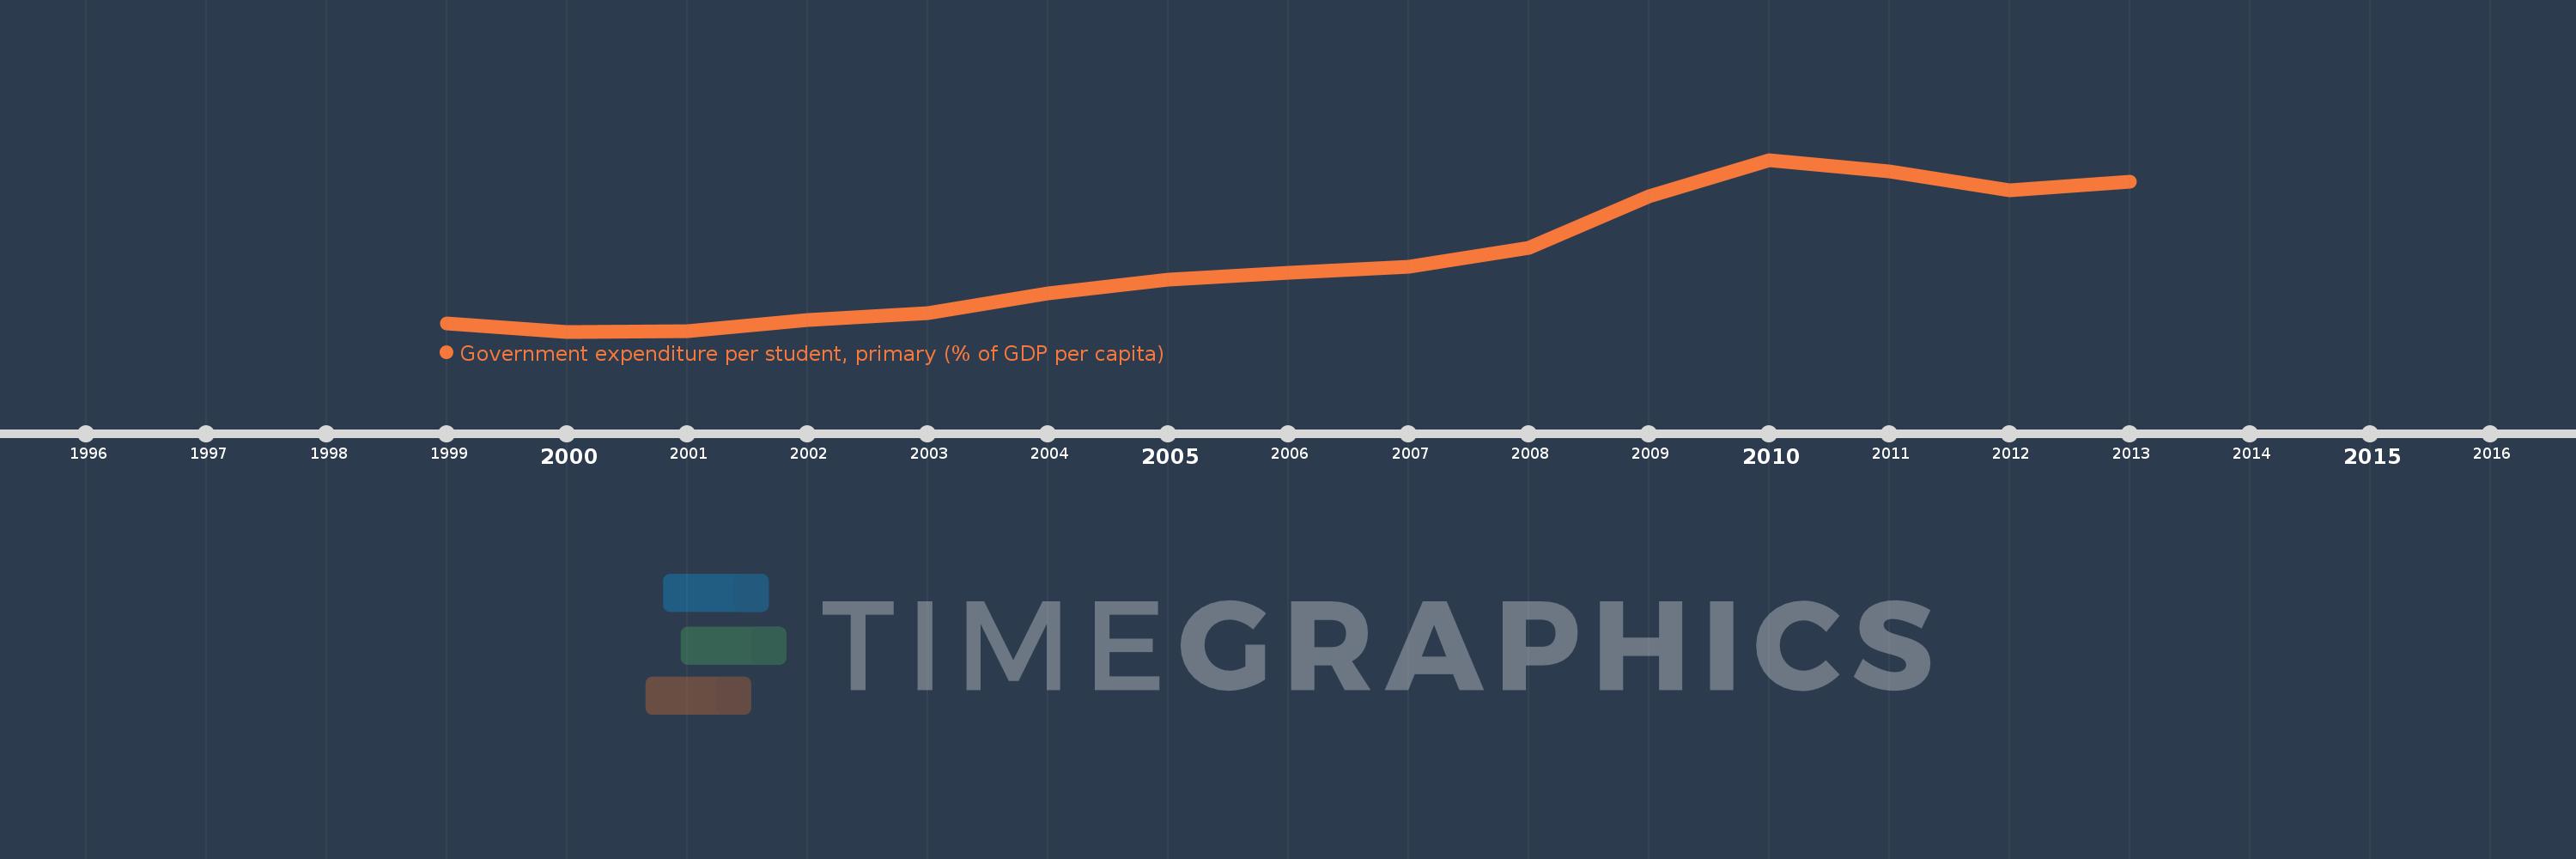
Government expenditure per student, primary (% of GDP per capita)
2013,2012,2011,2010,2009,2008,2007,2006,2005,2004,2003,2002,2001,2000,1999
This statistics in other country:
Timeline:
This timeline shows a graph from 1999 to 2013 of Ireland. No data until 1998. Number of actual observations by date: 15.
Source name:
World Development Indicators
Source organization:
United Nations Educational, Scientific, and Cultural Organization (UNESCO) Institute for Statistics.
Categories, topics:
Education
Last updated:
apr 23, 2017
Indicators value changes by year
Minimum:
10.766
jan 1, 2000
Maximum:
20.023
jan 1, 2010
At the date of observation
Value
Absolute change
Change from previous value
jan 1, 1999
11.204
+11.204
0.0%
jan 1, 2000
10.766
-0.438
-3.91%
jan 1, 2001
10.799
+0.033
0.31%
jan 1, 2002
11.397
+0.598
5.54%
jan 1, 2003
11.775
+0.378
3.32%
jan 1, 2004
12.814
+1.039
8.82%
jan 1, 2005
13.584
+0.77
6.01%
jan 1, 2006
13.957
+0.373
2.74%
jan 1, 2007
14.26
+0.303
2.17%
jan 1, 2008
15.286
+1.026
7.2%
jan 1, 2009
18.071
+2.785
18.22%
jan 1, 2010
20.023
+1.952
10.8%
jan 1, 2011
19.4
-0.622
-3.11%
jan 1, 2012
18.389
-1.011
-5.21%
jan 1, 2013
18.859
+0.47
2.56%
Ranking of countries by current statistics by years


Comments: