29
/
en
AIzaSyAYiBZKx7MnpbEhh9jyipgxe19OcubqV5w
April 1, 2024
54807
Post-demographic dividend
PST
false
2
1
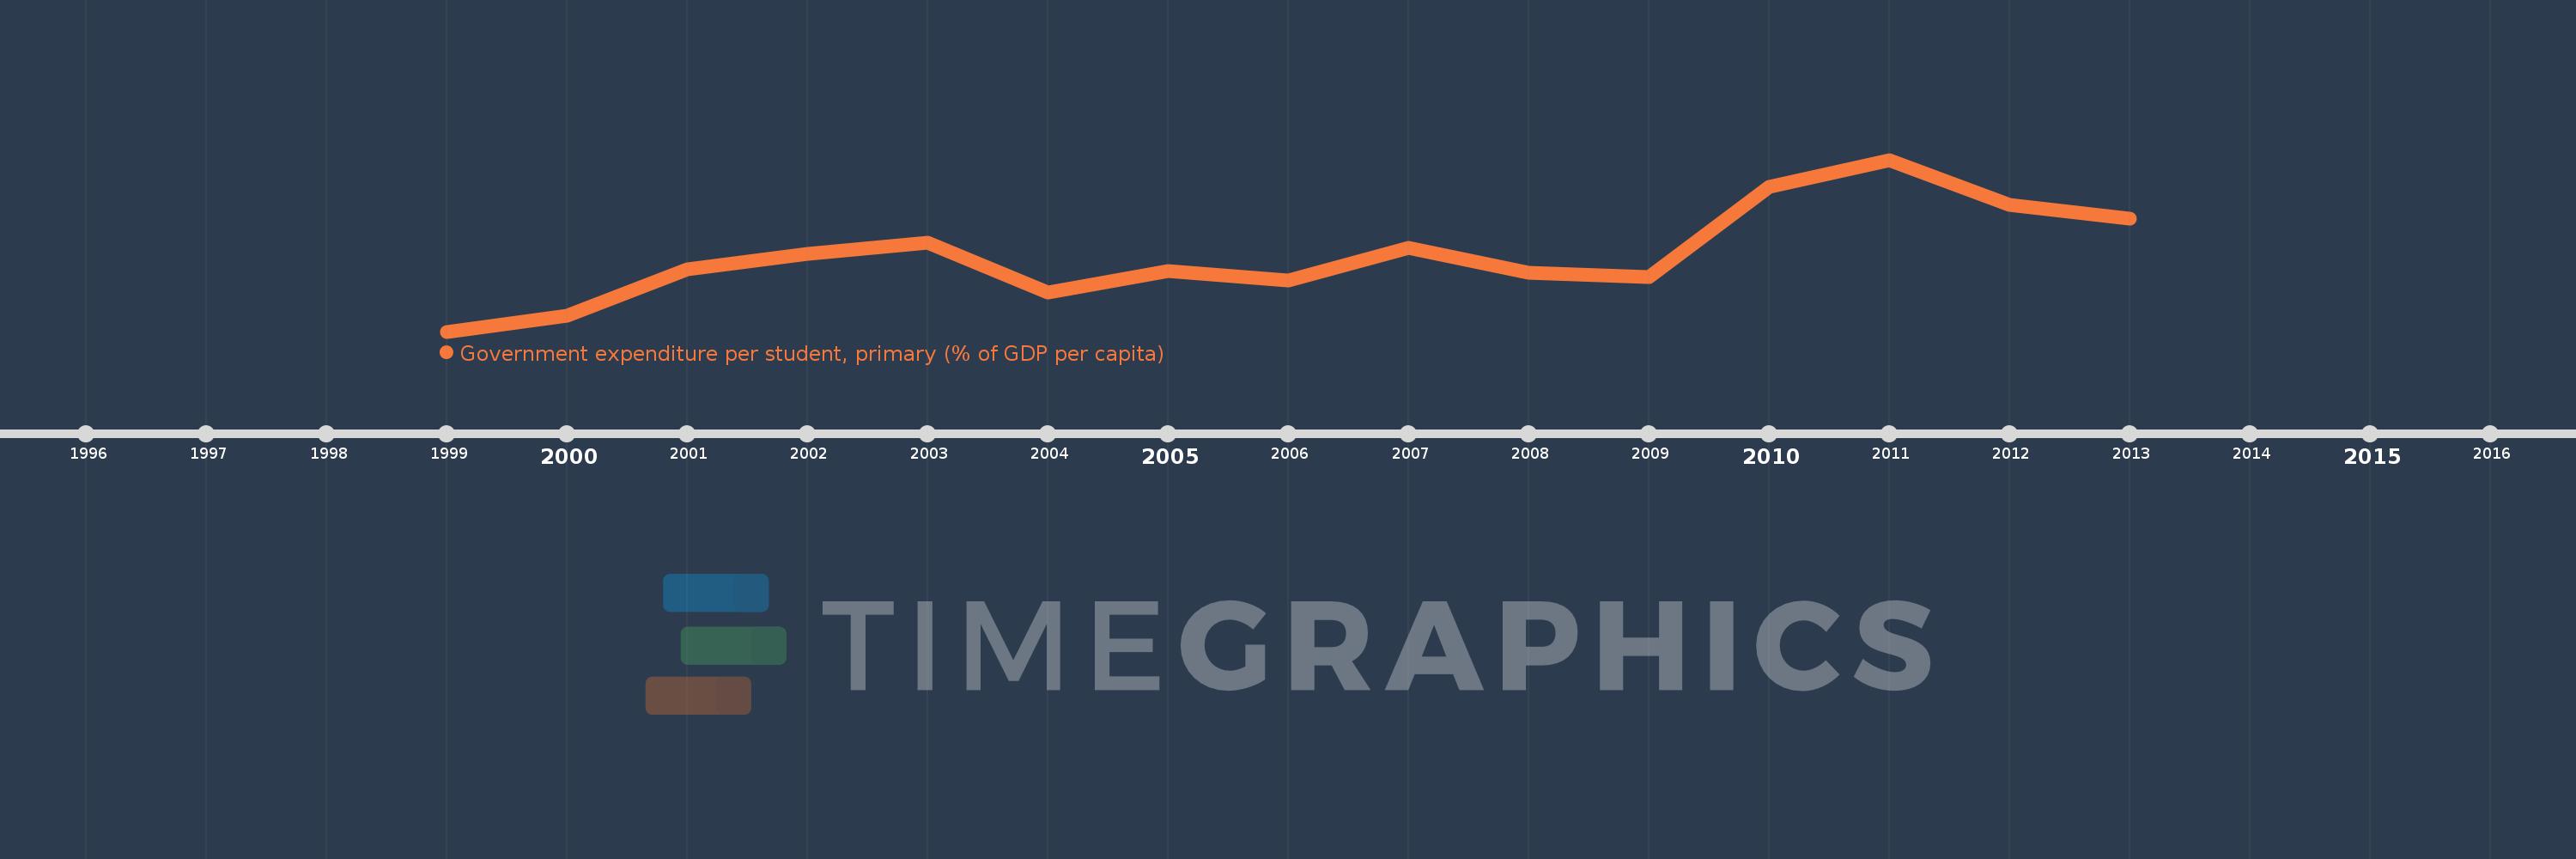
Government expenditure per student, primary (% of GDP per capita)
2013,2012,2011,2010,2009,2008,2007,2006,2005,2004,2003,2002,2001,2000,1999
This statistics in other country:
Timeline:
This timeline shows a graph from 1999 to 2013 of Post-demographic dividend. No data until 1998. Number of actual observations by date: 15.
Source name:
World Development Indicators
Source organization:
United Nations Educational, Scientific, and Cultural Organization (UNESCO) Institute for Statistics.
Categories, topics:
Education
Last updated:
apr 23, 2017
Indicators value changes by year
Minimum:
17.732
jan 1, 1999
Maximum:
22.029
jan 1, 2011
At the date of observation
Value
Absolute change
Change from previous value
jan 1, 1999
17.732
+17.732
0.0%
jan 1, 2000
18.138
+0.406
2.29%
jan 1, 2001
19.283
+1.145
6.31%
jan 1, 2002
19.674
+0.392
2.03%
jan 1, 2003
19.963
+0.289
1.47%
jan 1, 2004
18.719
-1.244
-6.23%
jan 1, 2005
19.243
+0.523
2.8%
jan 1, 2006
19.008
-0.235
-1.22%
jan 1, 2007
19.826
+0.818
4.3%
jan 1, 2008
19.211
-0.615
-3.1%
jan 1, 2009
19.098
-0.113
-0.59%
jan 1, 2010
21.354
+2.256
11.81%
jan 1, 2011
22.029
+0.676
3.16%
jan 1, 2012
20.893
-1.137
-5.16%
jan 1, 2013
20.565
-0.328
-1.57%
Ranking of countries by current statistics by years


Comments: