29
/
en
AIzaSyAYiBZKx7MnpbEhh9jyipgxe19OcubqV5w
April 1, 2024
209352
New Zealand
NZL
true
2
1
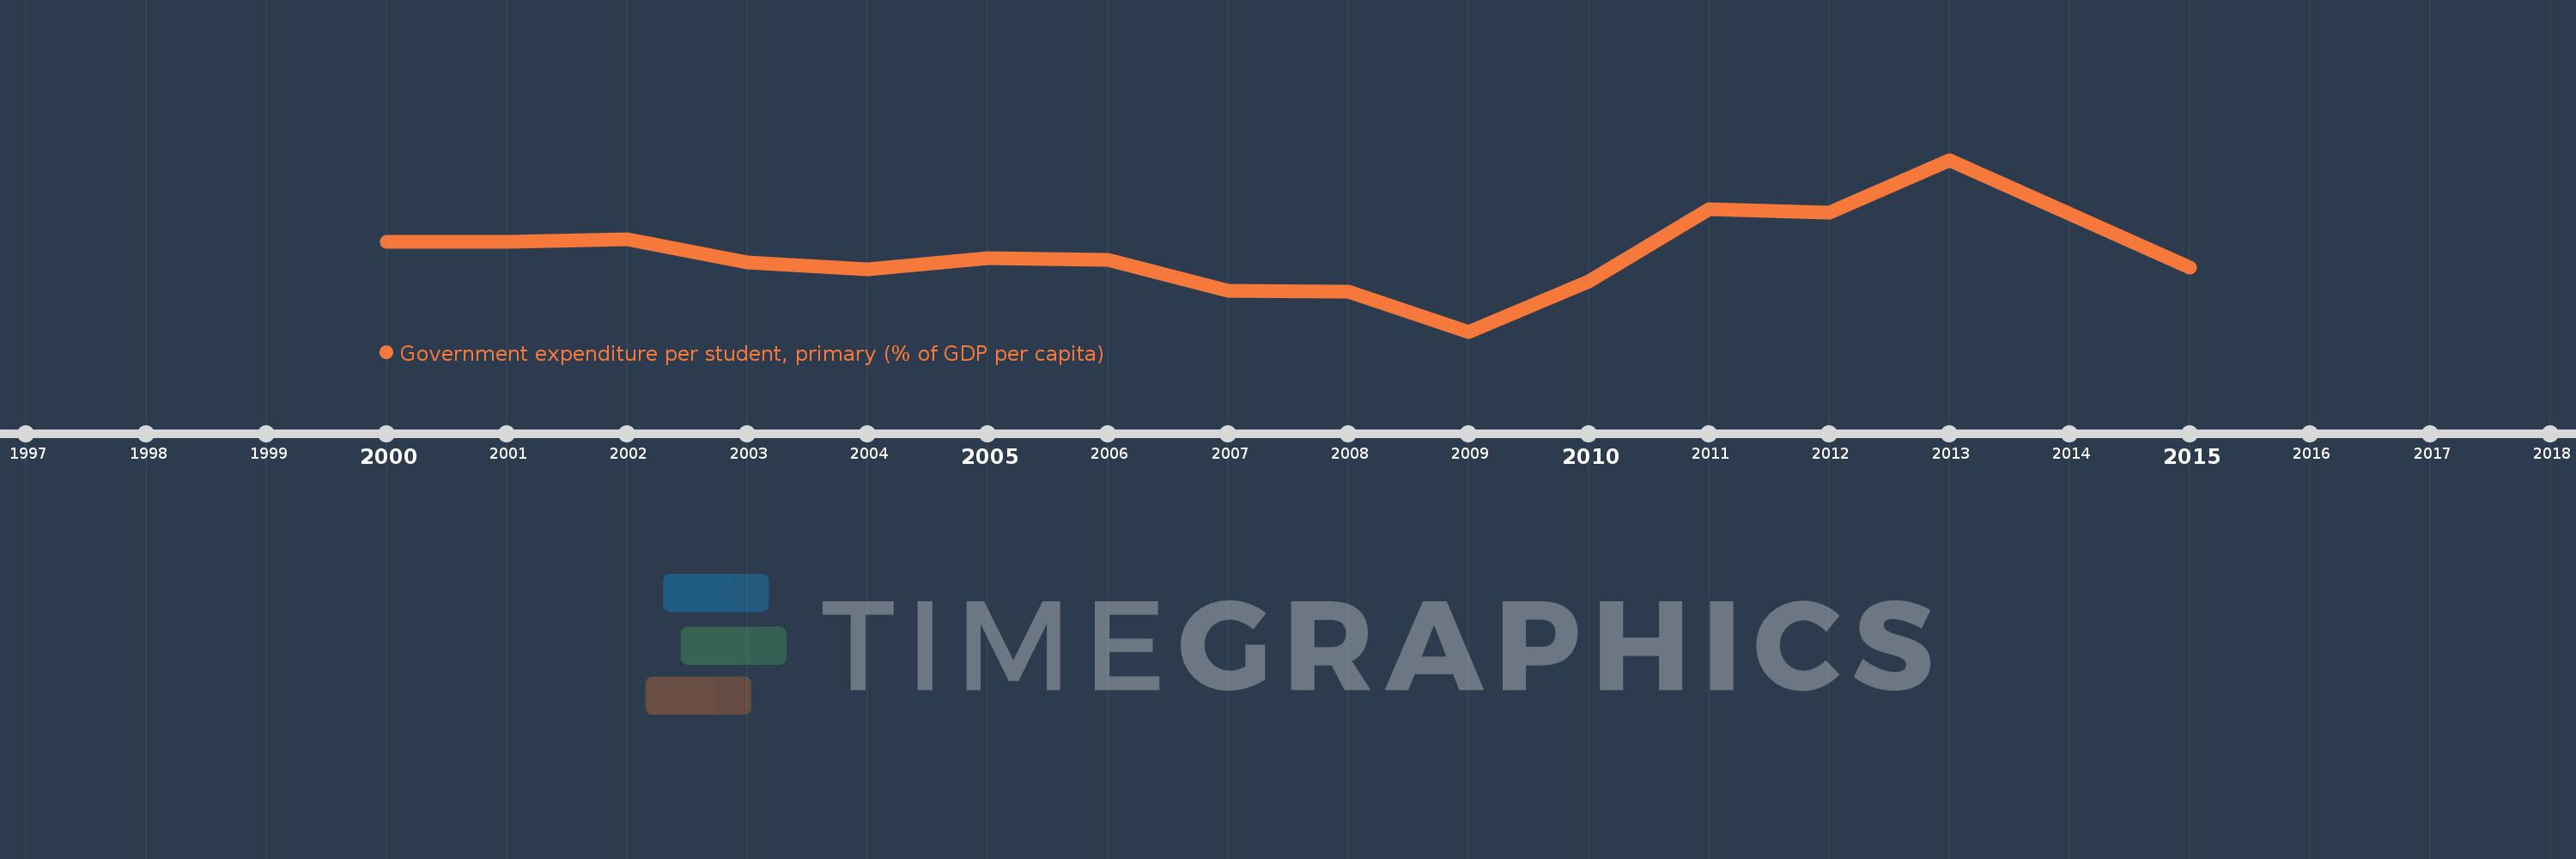
Government expenditure per student, primary (% of GDP per capita)
2015,2013,2012,2011,2010,2009,2008,2007,2006,2005,2004,2003,2002,2001,2000
This statistics in other country:
Timeline:
This timeline shows a graph from 2000 to 2015 of New Zealand. No data until 1999. Number of actual observations by date: 15.
Source name:
World Development Indicators
Source organization:
United Nations Educational, Scientific, and Cultural Organization (UNESCO) Institute for Statistics.
Categories, topics:
Education
Last updated:
apr 23, 2017
Indicators value changes by year
Minimum:
15.004
jan 1, 2009
Maximum:
23.827
jan 1, 2013
At the date of observation
Value
Absolute change
Change from previous value
jan 1, 2000
19.592
+19.592
0.0%
jan 1, 2001
19.61
+0.018
0.09%
jan 1, 2002
19.751
+0.142
0.72%
jan 1, 2003
18.565
-1.186
-6.0%
jan 1, 2004
18.198
-0.367
-1.98%
jan 1, 2005
18.755
+0.557
3.06%
jan 1, 2006
18.694
-0.061
-0.33%
jan 1, 2007
17.085
-1.608
-8.6%
jan 1, 2008
17.036
-0.049
-0.29%
jan 1, 2009
15.004
-2.032
-11.93%
jan 1, 2010
17.606
+2.601
17.34%
jan 1, 2011
21.273
+3.667
20.83%
jan 1, 2012
21.134
-0.139
-0.66%
jan 1, 2013
23.827
+2.694
12.75%
jan 1, 2015
18.273
-5.554
-23.31%
Ranking of countries by current statistics by years


Comments: