29
/
en
AIzaSyAYiBZKx7MnpbEhh9jyipgxe19OcubqV5w
April 1, 2024
116924
Cyprus
CYP
true
2
1
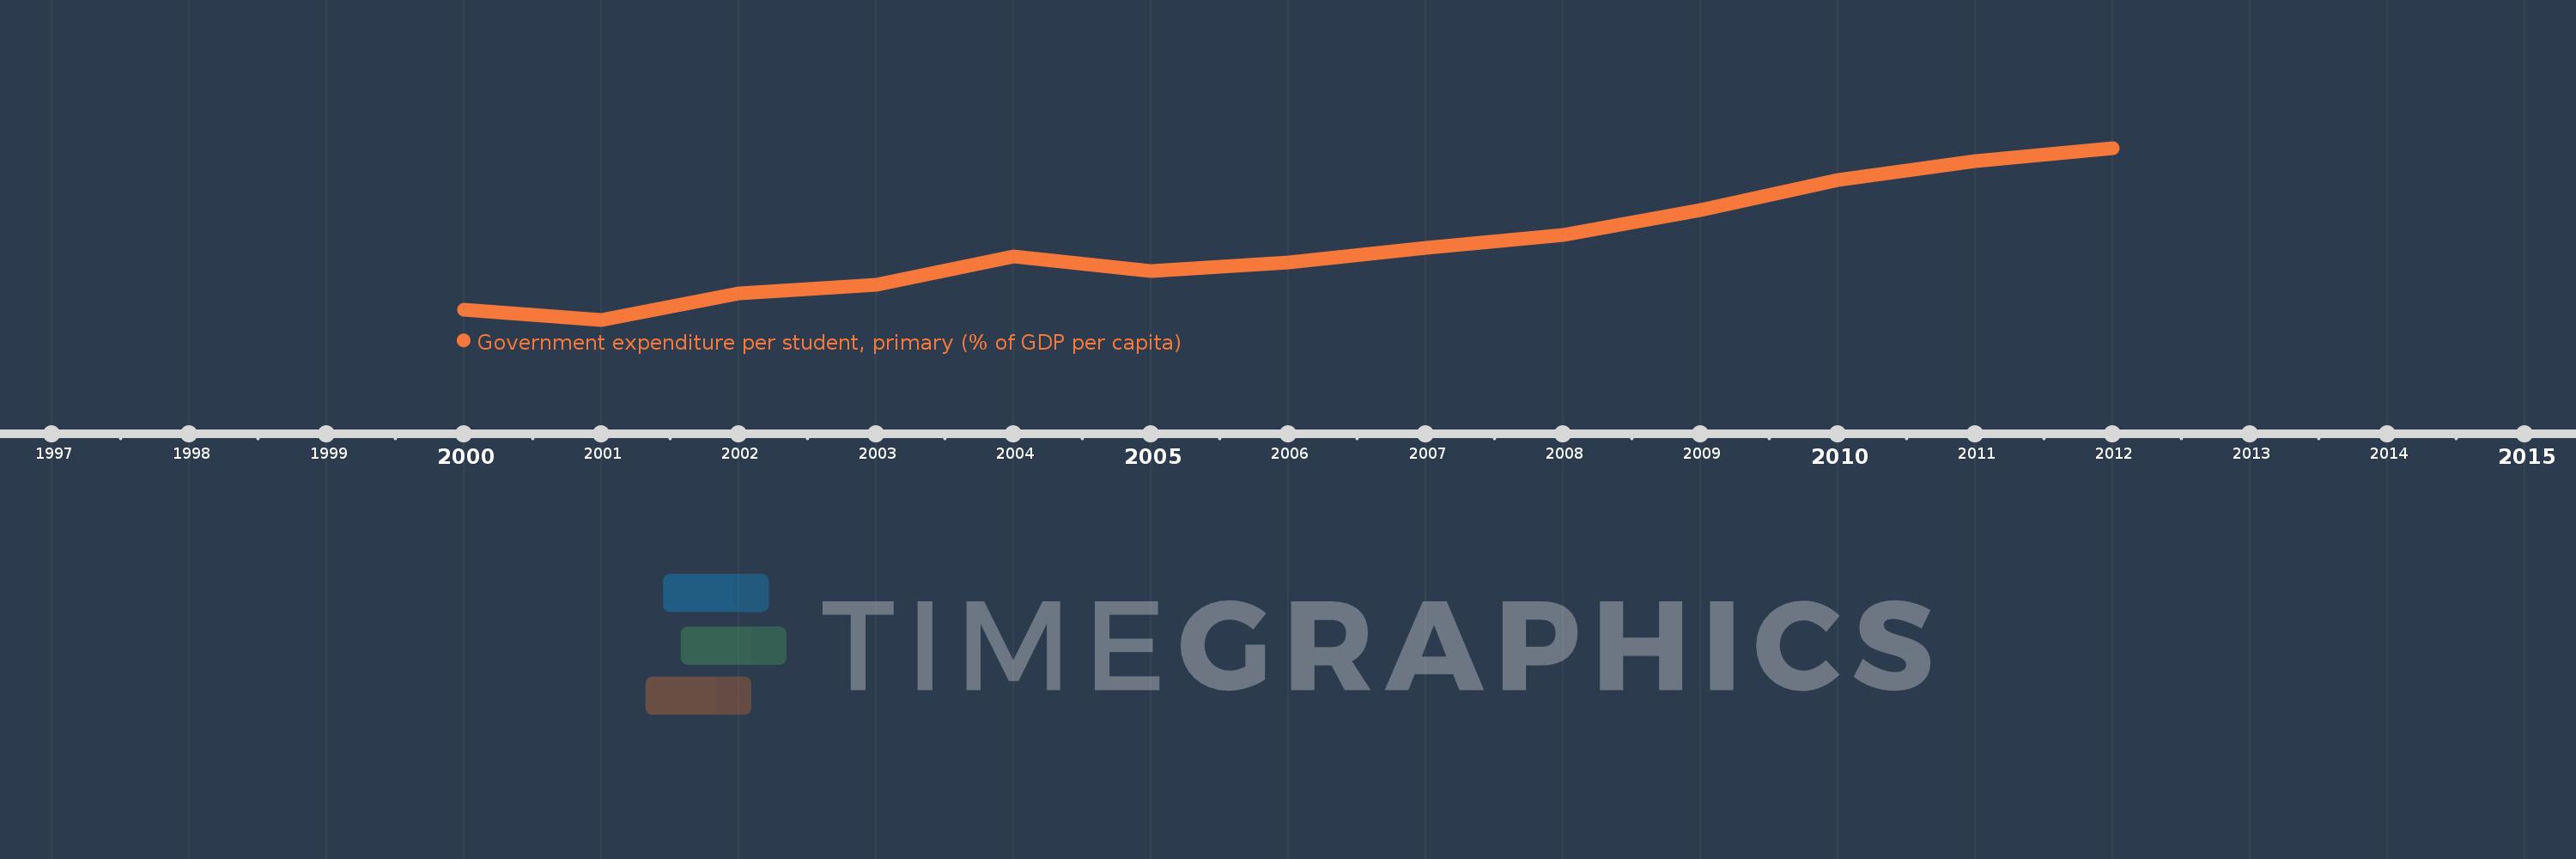
Government expenditure per student, primary (% of GDP per capita)
2012,2011,2010,2009,2008,2007,2006,2005,2004,2003,2002,2001,2000
This statistics in other country:
Timeline:
This timeline shows a graph from 2000 to 2012 of Cyprus. No data until 1999. Number of actual observations by date: 13.
Source name:
World Development Indicators
Source organization:
United Nations Educational, Scientific, and Cultural Organization (UNESCO) Institute for Statistics.
Categories, topics:
Education
Last updated:
apr 23, 2017
Indicators value changes by year
Minimum:
15.013
jan 1, 2001
At the date of observation
Value
Absolute change
Change from previous value
jan 1, 2000
16.015
+16.015
0.0%
jan 1, 2001
15.013
-1.002
-6.26%
jan 1, 2002
17.691
+2.678
17.84%
jan 1, 2003
18.546
+0.855
4.83%
jan 1, 2004
21.45
+2.904
15.66%
jan 1, 2005
20.025
-1.425
-6.64%
jan 1, 2006
20.884
+0.859
4.29%
jan 1, 2007
22.353
+1.469
7.04%
jan 1, 2008
23.72
+1.367
6.12%
jan 1, 2009
26.197
+2.477
10.44%
jan 1, 2010
29.279
+3.082
11.76%
jan 1, 2011
31.263
+1.984
6.78%
jan 1, 2012
32.57
+1.307
4.18%
Ranking of countries by current statistics by years


Comments: