29
/
en
AIzaSyAYiBZKx7MnpbEhh9jyipgxe19OcubqV5w
April 1, 2024
147980
Guyana
GUY
true
2
1
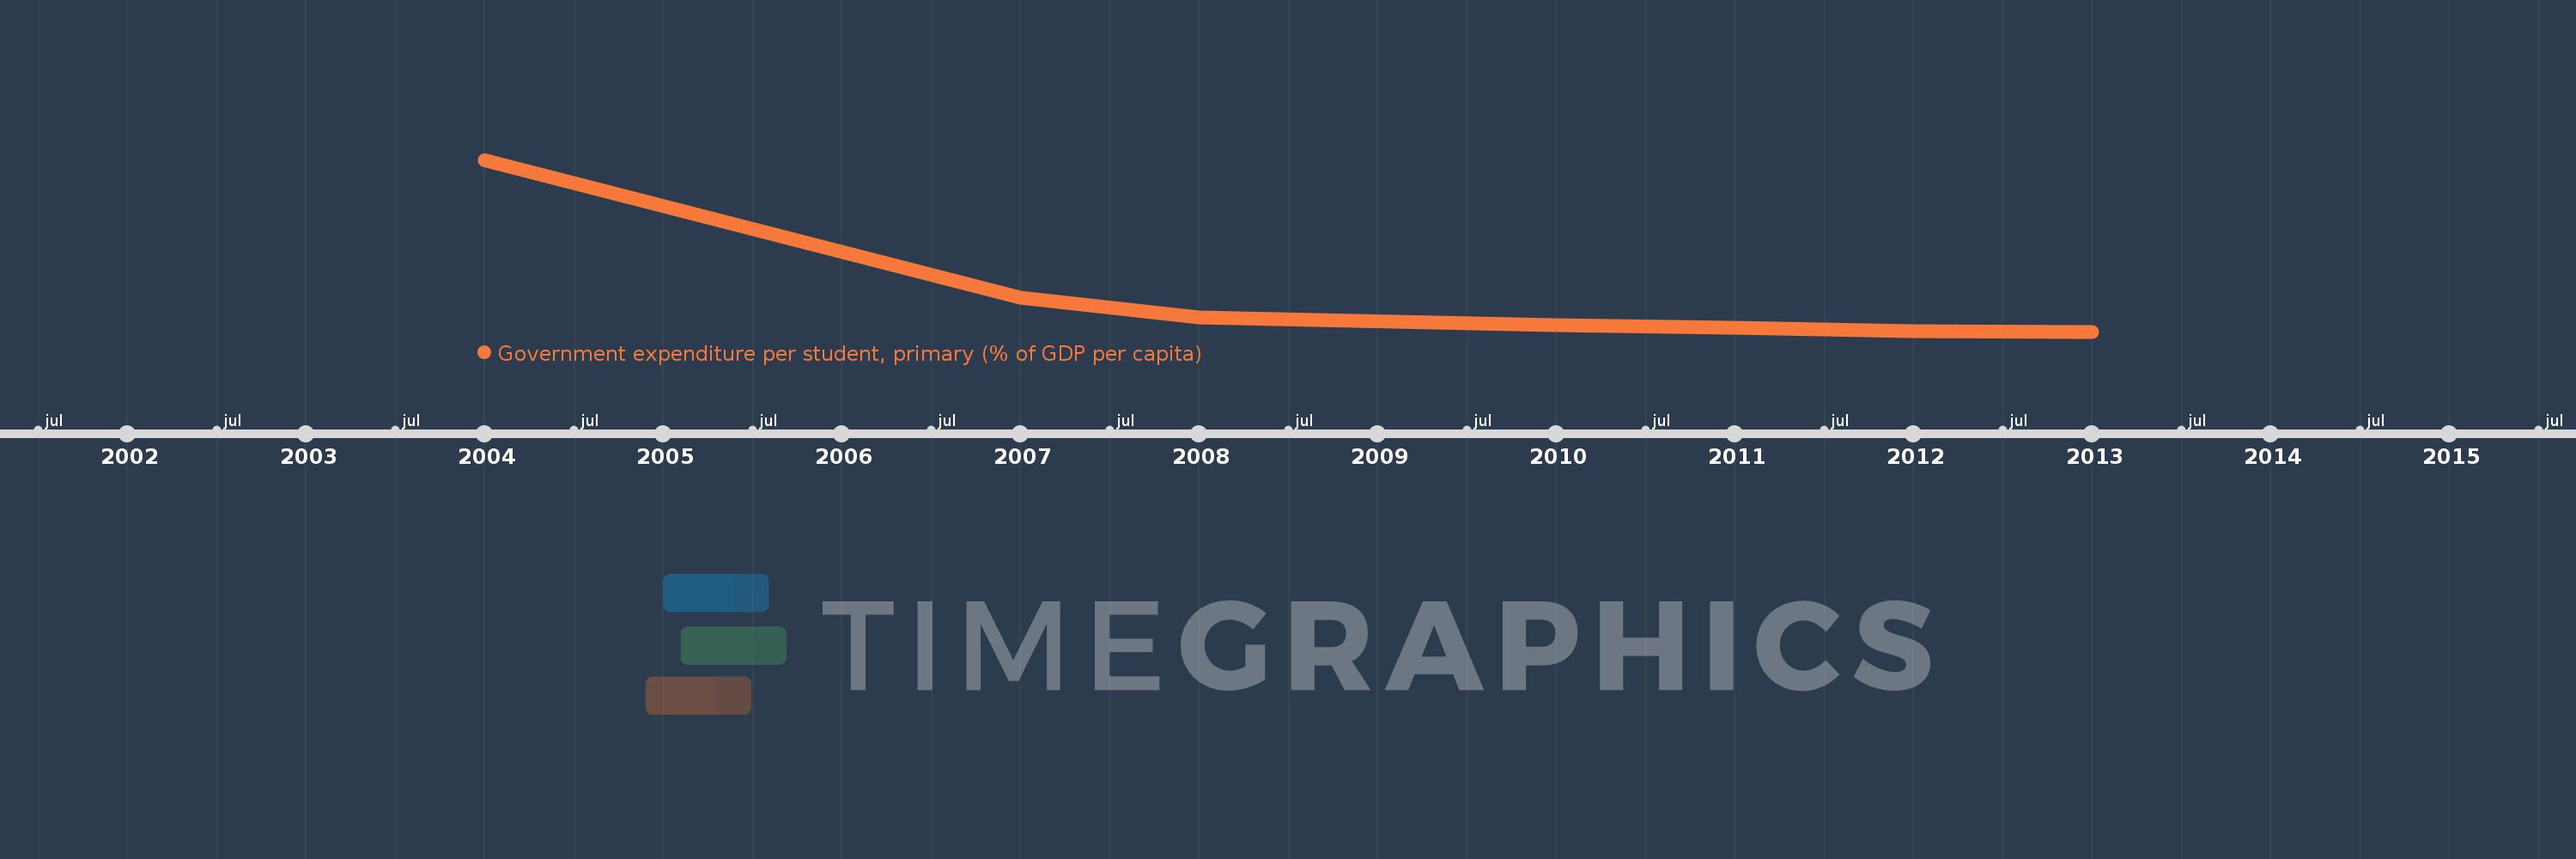
Government expenditure per student, primary (% of GDP per capita)
2013,2012,2011,2010,2008,2007,2004
This statistics in other country:
Timeline:
This timeline shows a graph from 2004 to 2013 of Guyana. No data until 2003. Number of actual observations by date: 7.
Source name:
World Development Indicators
Source organization:
United Nations Educational, Scientific, and Cultural Organization (UNESCO) Institute for Statistics.
Categories, topics:
Education
Last updated:
apr 23, 2017
Indicators value changes by year
Maximum:
18.067
jan 1, 2004
At the date of observation
Value
Absolute change
Change from previous value
jan 1, 2004
18.067
+18.067
0.0%
jan 1, 2007
9.866
-8.202
-45.39%
jan 1, 2008
8.693
-1.173
-11.89%
jan 1, 2010
8.196
-0.497
-5.72%
jan 1, 2011
8.076
-0.12
-1.46%
jan 1, 2012
7.845
-0.231
-2.86%
jan 1, 2013
7.833
-0.012
-0.15%
Ranking of countries by current statistics by years


Comments: