29
/
en
AIzaSyAYiBZKx7MnpbEhh9jyipgxe19OcubqV5w
April 1, 2024
42410
Latin America & Caribbean (excluding high income)
LAC
false
2
1
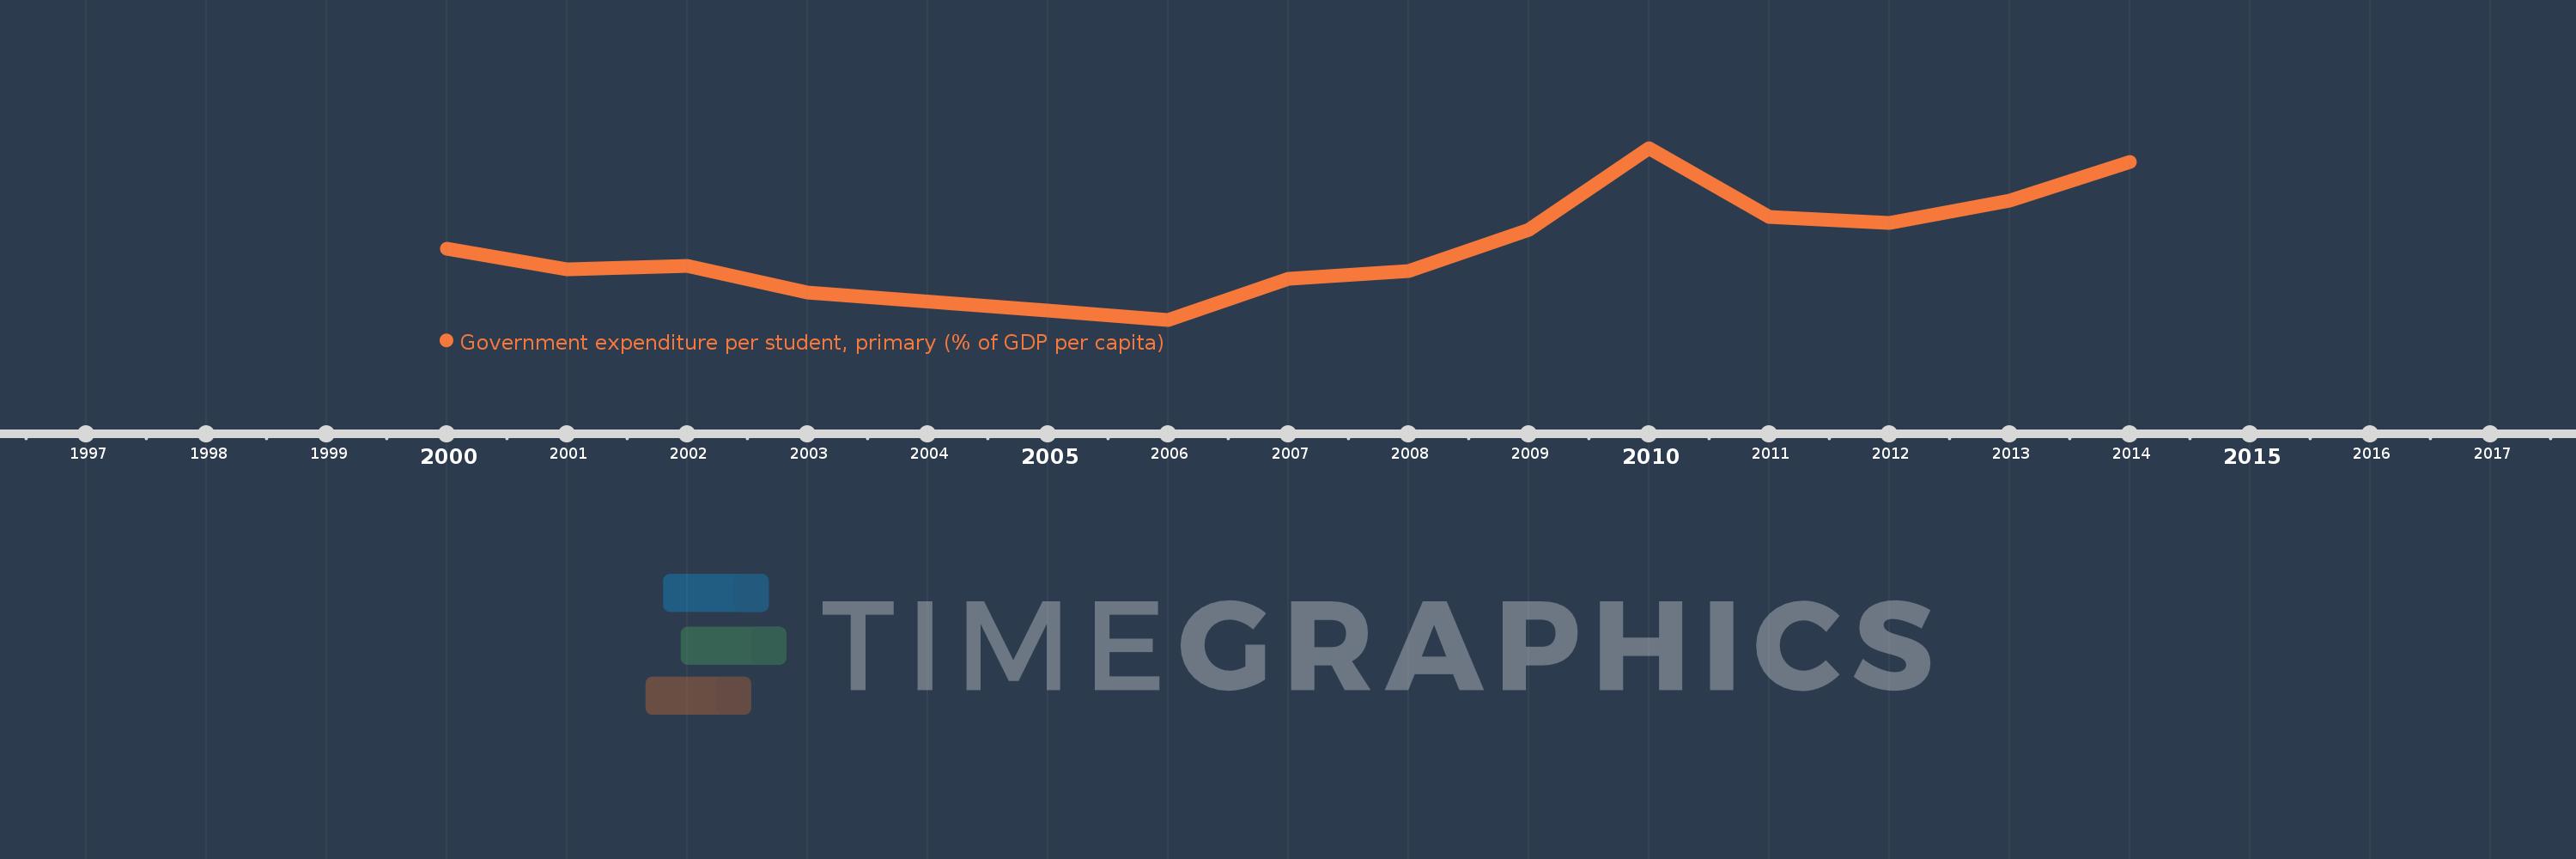
Government expenditure per student, primary (% of GDP per capita)
2014,2013,2012,2011,2010,2009,2008,2007,2006,2005,2003,2002,2001,2000
This statistics in other country:
Timeline:
This timeline shows a graph from 2000 to 2014 of Latin America & Caribbean (excluding high income). No data until 1999. Number of actual observations by date: 14.
Source name:
World Development Indicators
Source organization:
United Nations Educational, Scientific, and Cultural Organization (UNESCO) Institute for Statistics.
Categories, topics:
Education
Last updated:
apr 23, 2017
Indicators value changes by year
At the date of observation
Value
Absolute change
Change from previous value
jan 1, 2000
12.485
+12.485
0.0%
jan 1, 2001
11.637
-0.849
-6.8%
jan 1, 2002
11.777
+0.14
1.21%
jan 1, 2003
10.666
-1.111
-9.44%
jan 1, 2005
9.922
-0.744
-6.98%
jan 1, 2006
9.543
-0.378
-3.81%
jan 1, 2007
11.24
+1.696
17.77%
jan 1, 2008
11.561
+0.321
2.86%
jan 1, 2009
13.264
+1.704
14.74%
jan 1, 2010
16.62
+3.355
25.29%
jan 1, 2011
13.786
-2.834
-17.05%
jan 1, 2012
13.519
-0.267
-1.94%
jan 1, 2013
14.449
+0.93
6.88%
jan 1, 2014
16.041
+1.592
11.02%
Ranking of countries by current statistics by years


Comments: