29
/
en
AIzaSyAYiBZKx7MnpbEhh9jyipgxe19OcubqV5w
April 1, 2024
160525
Israel
ISR
true
2
1
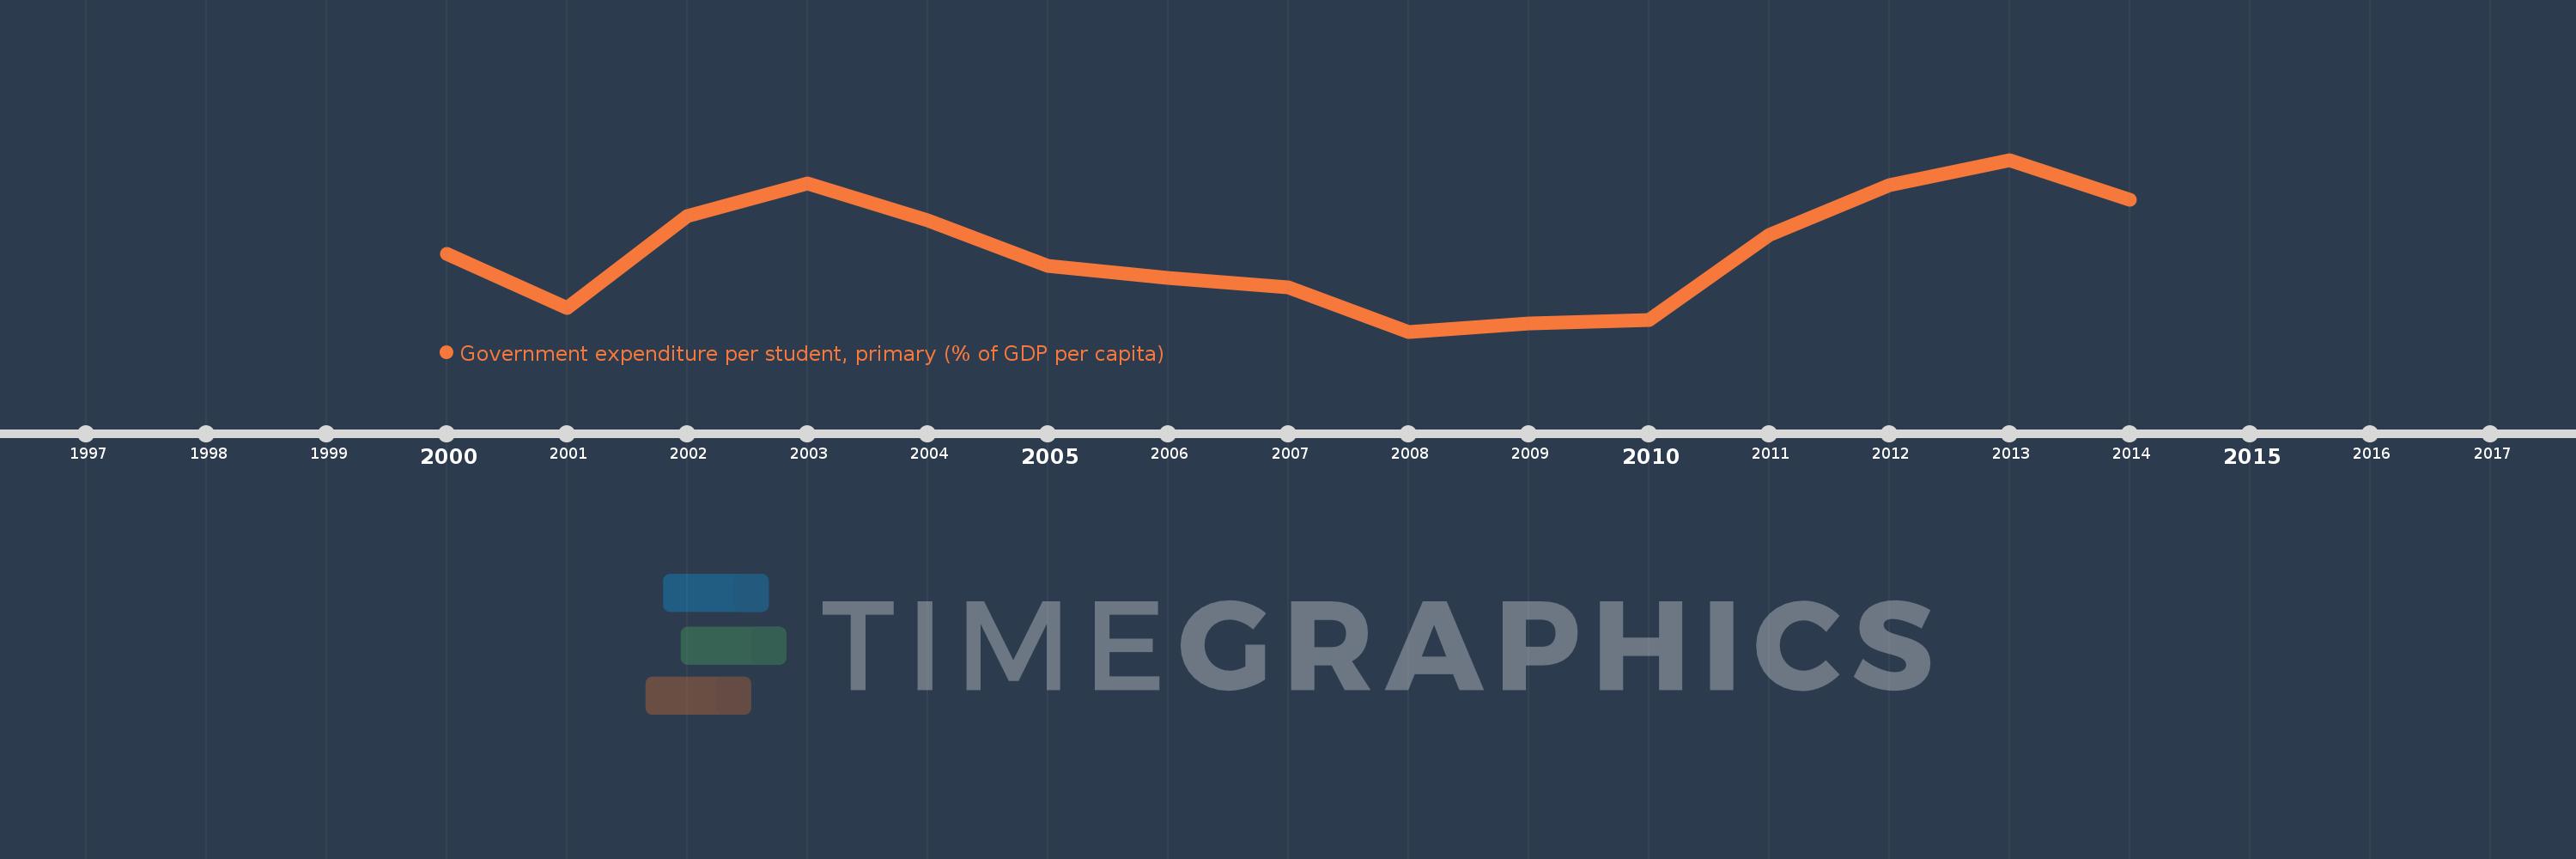
Government expenditure per student, primary (% of GDP per capita)
2014,2013,2012,2011,2010,2009,2008,2007,2006,2005,2004,2003,2002,2001,2000
This statistics in other country:
Timeline:
This timeline shows a graph from 2000 to 2014 of Israel. No data until 1999. Number of actual observations by date: 15.
Source name:
World Development Indicators
Source organization:
United Nations Educational, Scientific, and Cultural Organization (UNESCO) Institute for Statistics.
Categories, topics:
Education
Last updated:
apr 23, 2017
Indicators value changes by year
Minimum:
19.692
jan 1, 2008
Maximum:
22.877
jan 1, 2013
At the date of observation
Value
Absolute change
Change from previous value
jan 1, 2000
21.128
+21.128
0.0%
jan 1, 2001
20.137
-0.992
-4.69%
jan 1, 2002
21.838
+1.701
8.45%
jan 1, 2003
22.446
+0.608
2.78%
jan 1, 2004
21.752
-0.694
-3.09%
jan 1, 2005
20.91
-0.841
-3.87%
jan 1, 2006
20.69
-0.221
-1.06%
jan 1, 2007
20.514
-0.175
-0.85%
jan 1, 2008
19.692
-0.823
-4.01%
jan 1, 2009
19.847
+0.156
0.79%
jan 1, 2010
19.907
+0.059
0.3%
jan 1, 2011
21.489
+1.582
7.95%
jan 1, 2012
22.403
+0.914
4.25%
jan 1, 2013
22.877
+0.474
2.12%
jan 1, 2014
22.139
-0.737
-3.22%
Ranking of countries by current statistics by years


Comments: