29
/
en
AIzaSyAYiBZKx7MnpbEhh9jyipgxe19OcubqV5w
April 1, 2024
181136
Lithuania
LTU
true
2
1
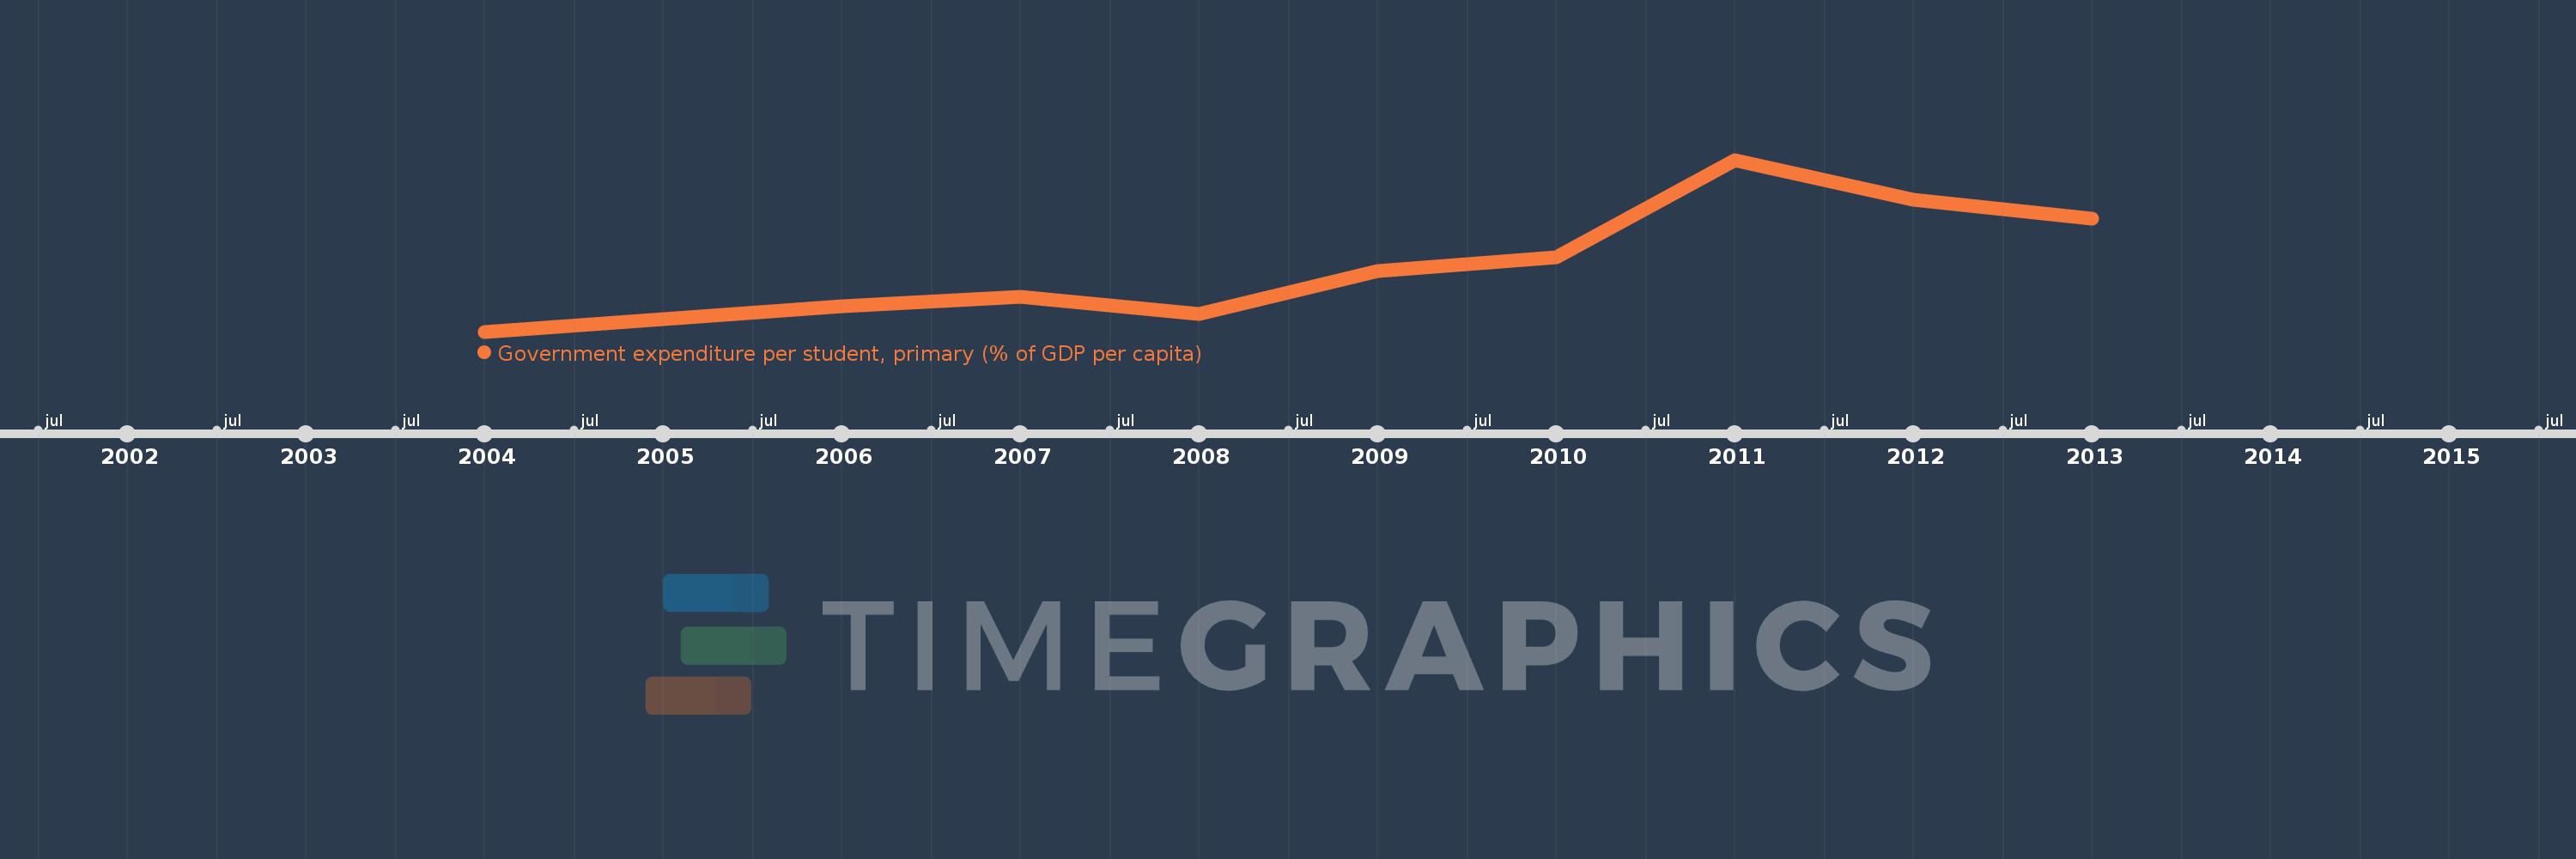
Government expenditure per student, primary (% of GDP per capita)
2013,2012,2011,2010,2009,2008,2007,2006,2005,2004
This statistics in other country:
Timeline:
This timeline shows a graph from 2004 to 2013 of Lithuania. No data until 2003. Number of actual observations by date: 10.
Source name:
World Development Indicators
Source organization:
United Nations Educational, Scientific, and Cultural Organization (UNESCO) Institute for Statistics.
Categories, topics:
Education
Last updated:
apr 23, 2017
Indicators value changes by year
Minimum:
14.062
jan 1, 2004
Maximum:
22.401
jan 1, 2011
At the date of observation
Value
Absolute change
Change from previous value
jan 1, 2004
14.062
+14.062
0.0%
jan 1, 2005
14.68
+0.618
4.39%
jan 1, 2006
15.276
+0.597
4.06%
jan 1, 2007
15.765
+0.489
3.2%
jan 1, 2008
14.897
-0.868
-5.51%
jan 1, 2009
16.992
+2.095
14.06%
jan 1, 2010
17.668
+0.676
3.98%
jan 1, 2011
22.401
+4.733
26.79%
jan 1, 2012
20.451
-1.95
-8.71%
jan 1, 2013
19.526
-0.925
-4.52%
Ranking of countries by current statistics by years


Comments: