29
/
en
AIzaSyAYiBZKx7MnpbEhh9jyipgxe19OcubqV5w
April 1, 2024
228519
Romania
ROU
true
2
1
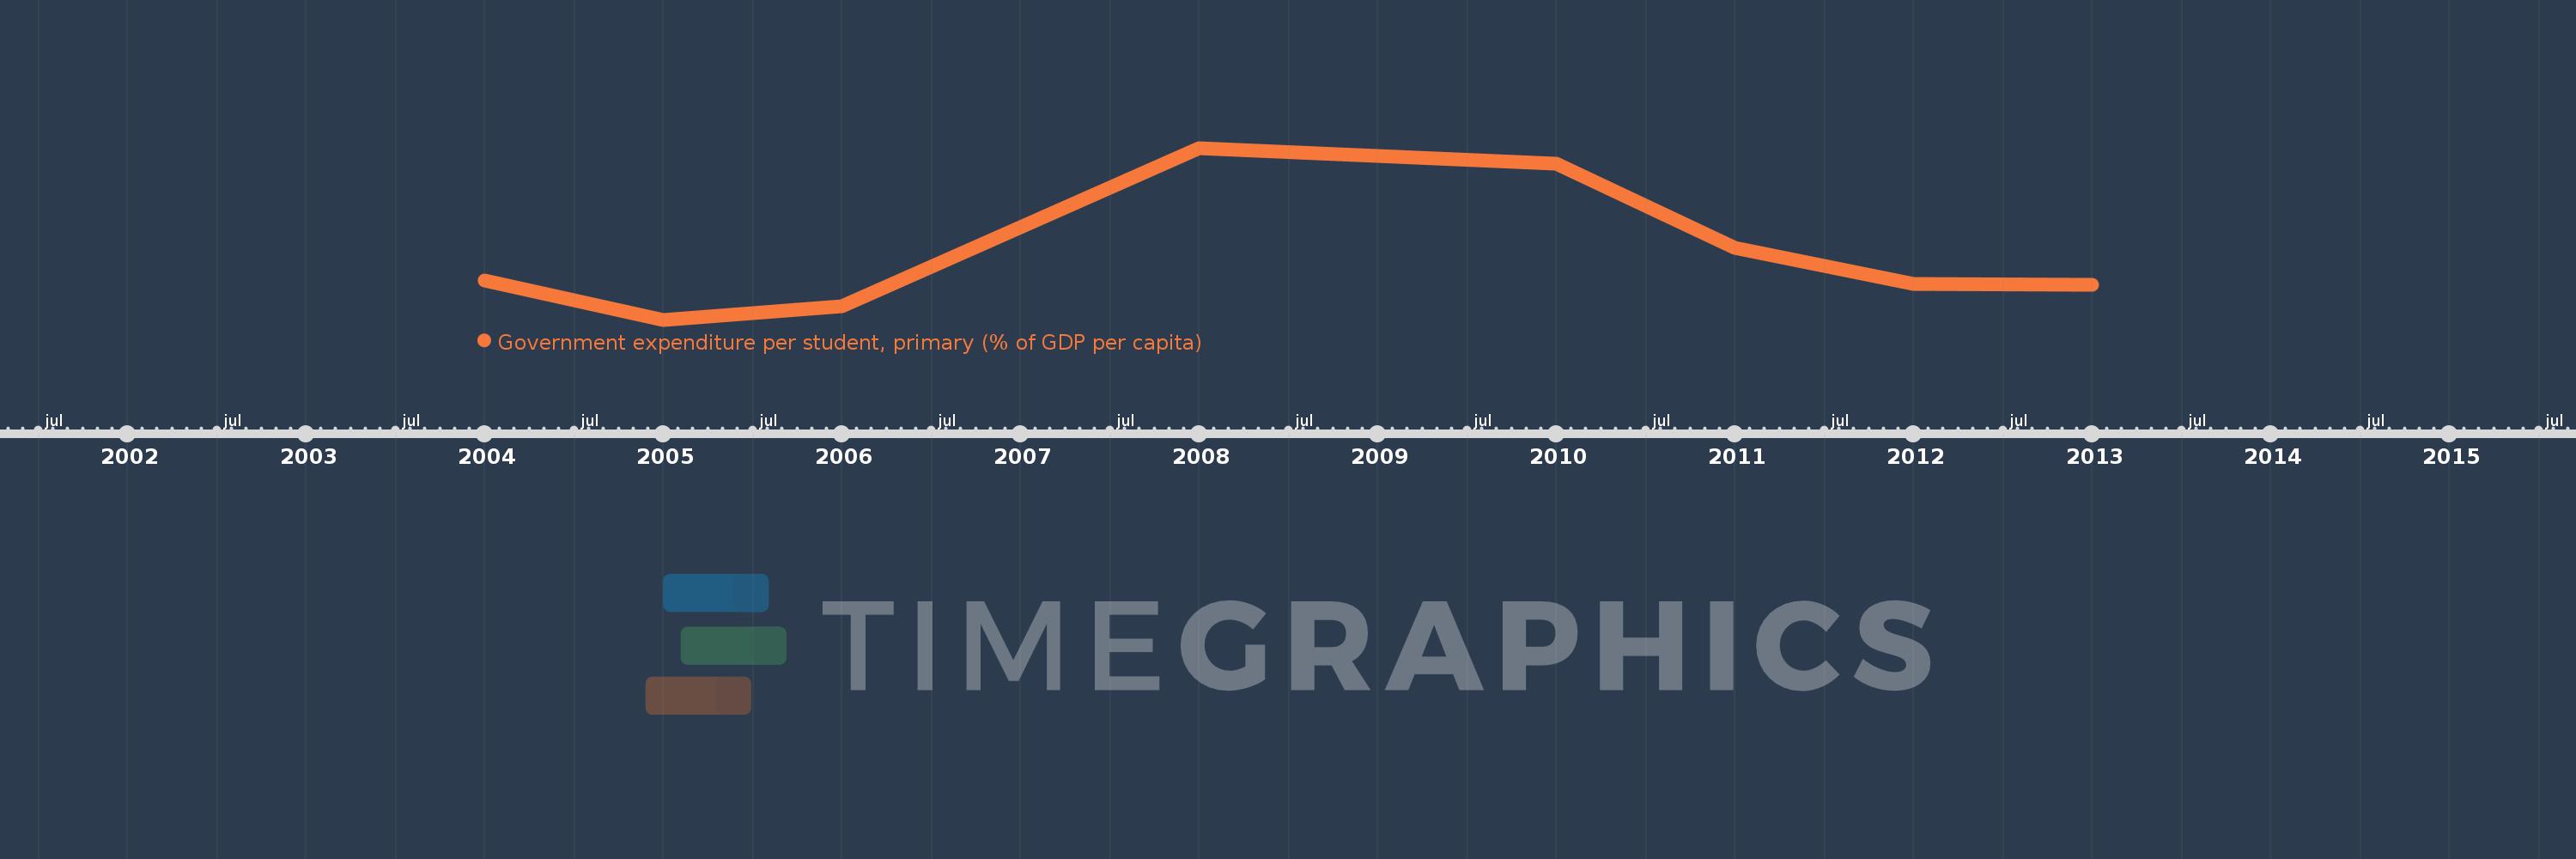
Government expenditure per student, primary (% of GDP per capita)
2013,2012,2011,2010,2008,2006,2005,2004
This statistics in other country:
Timeline:
This timeline shows a graph from 2004 to 2013 of Romania. No data until 2003. Number of actual observations by date: 8.
Source name:
World Development Indicators
Source organization:
United Nations Educational, Scientific, and Cultural Organization (UNESCO) Institute for Statistics.
Categories, topics:
Education
Last updated:
apr 23, 2017
Indicators value changes by year
Maximum:
19.117
jan 1, 2008
At the date of observation
Value
Absolute change
Change from previous value
jan 1, 2004
11.854
+11.854
0.0%
jan 1, 2005
9.708
-2.146
-18.1%
jan 1, 2006
10.458
+0.751
7.73%
jan 1, 2008
19.117
+8.659
82.79%
jan 1, 2010
18.248
-0.869
-4.54%
jan 1, 2011
13.642
-4.607
-25.24%
jan 1, 2012
11.671
-1.971
-14.45%
jan 1, 2013
11.628
-0.043
-0.37%
Ranking of countries by current statistics by years


Comments: