29
/
en
AIzaSyAYiBZKx7MnpbEhh9jyipgxe19OcubqV5w
April 1, 2024
72234
Aruba
ABW
true
2
1
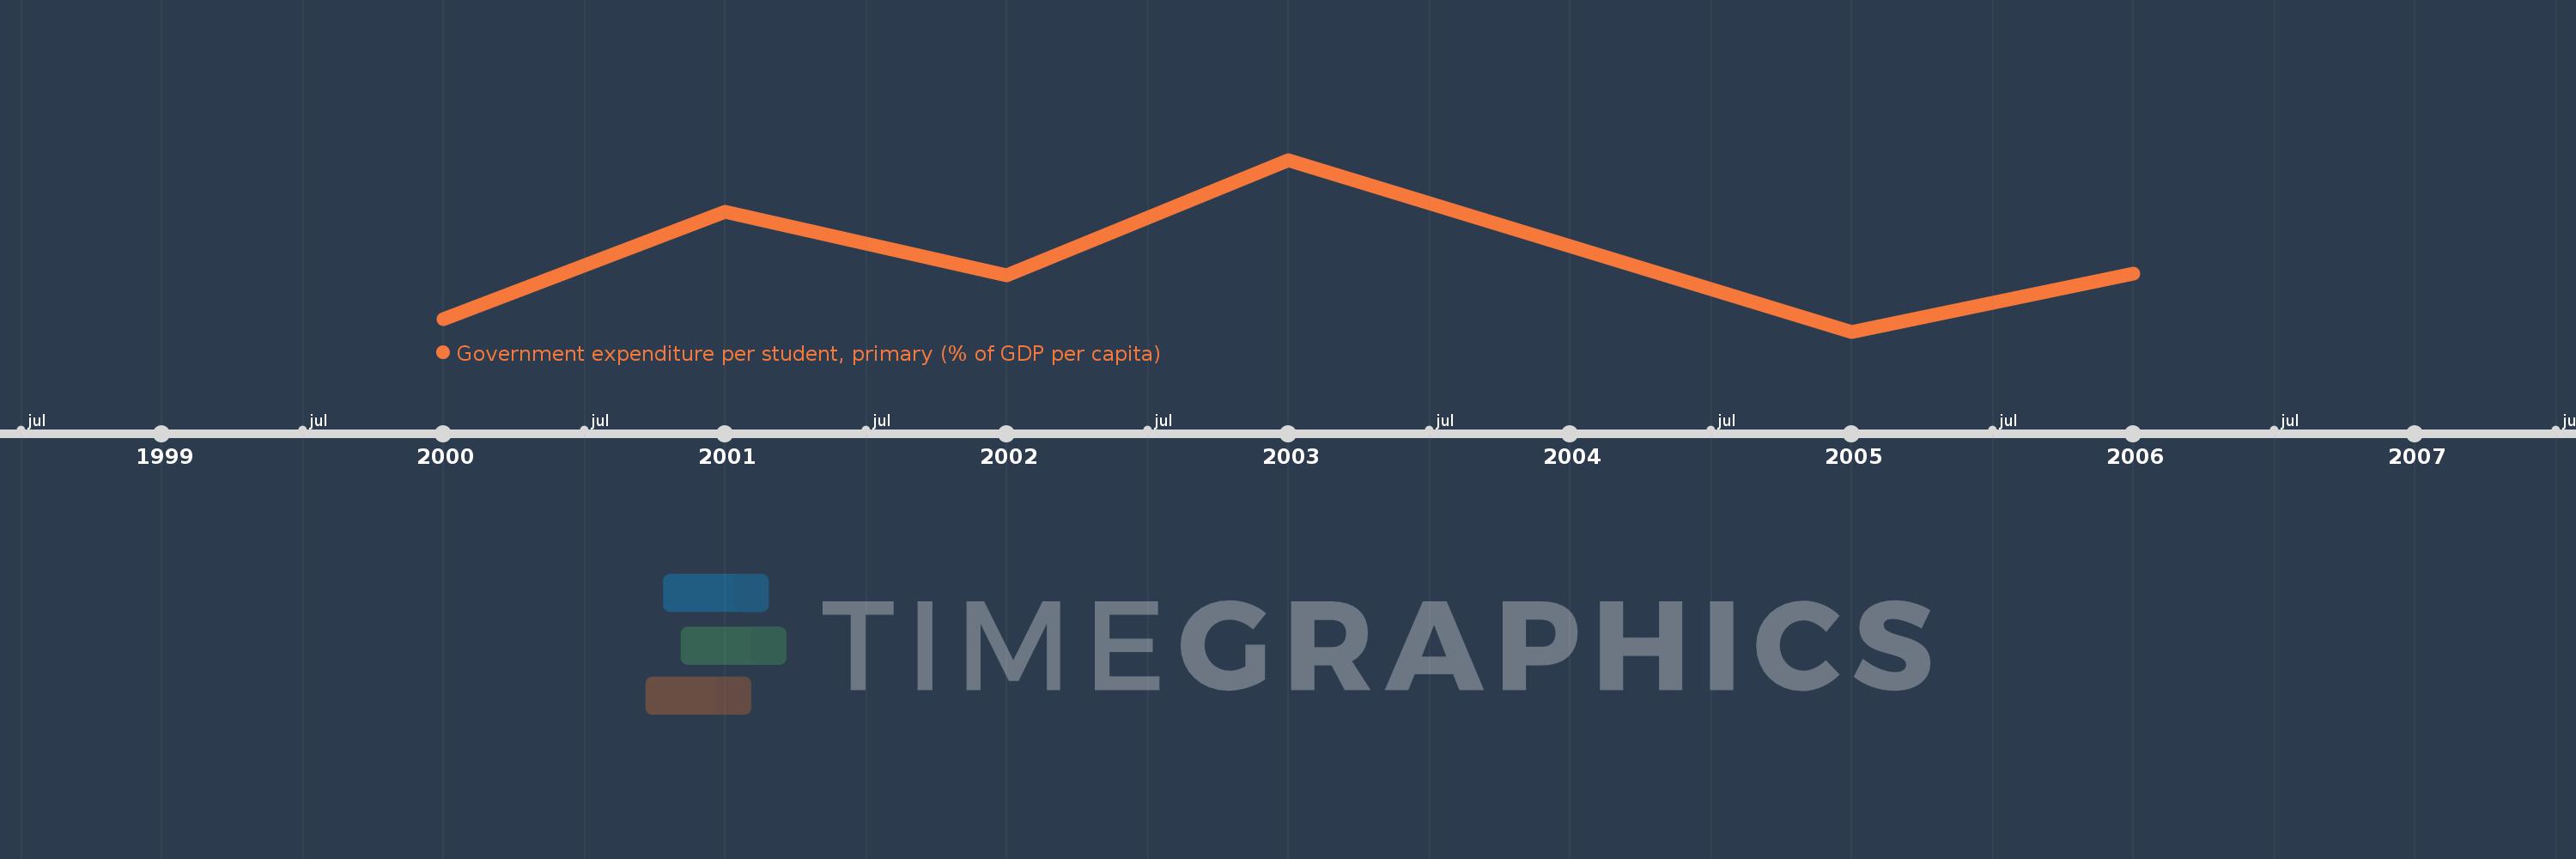
Government expenditure per student, primary (% of GDP per capita)
2006,2005,2003,2002,2001,2000
This statistics in other country:
Timeline:
This timeline shows a graph from 2000 to 2006 of Aruba. No data until 1999. Number of actual observations by date: 6.
Source name:
World Development Indicators
Source organization:
United Nations Educational, Scientific, and Cultural Organization (UNESCO) Institute for Statistics.
Categories, topics:
Education
Last updated:
apr 23, 2017
Indicators value changes by year
Minimum:
11.414
jan 1, 2005
Maximum:
13.785
jan 1, 2003
At the date of observation
Value
Absolute change
Change from previous value
jan 1, 2000
11.591
+11.591
0.0%
jan 1, 2001
13.064
+1.473
12.71%
jan 1, 2002
12.194
-0.87
-6.66%
jan 1, 2003
13.785
+1.592
13.05%
jan 1, 2005
11.414
-2.371
-17.2%
jan 1, 2006
12.211
+0.797
6.98%
Ranking of countries by current statistics by years


Comments: