29
/
en
AIzaSyAYiBZKx7MnpbEhh9jyipgxe19OcubqV5w
April 1, 2024
29887
Euro area
EMU
false
2
1
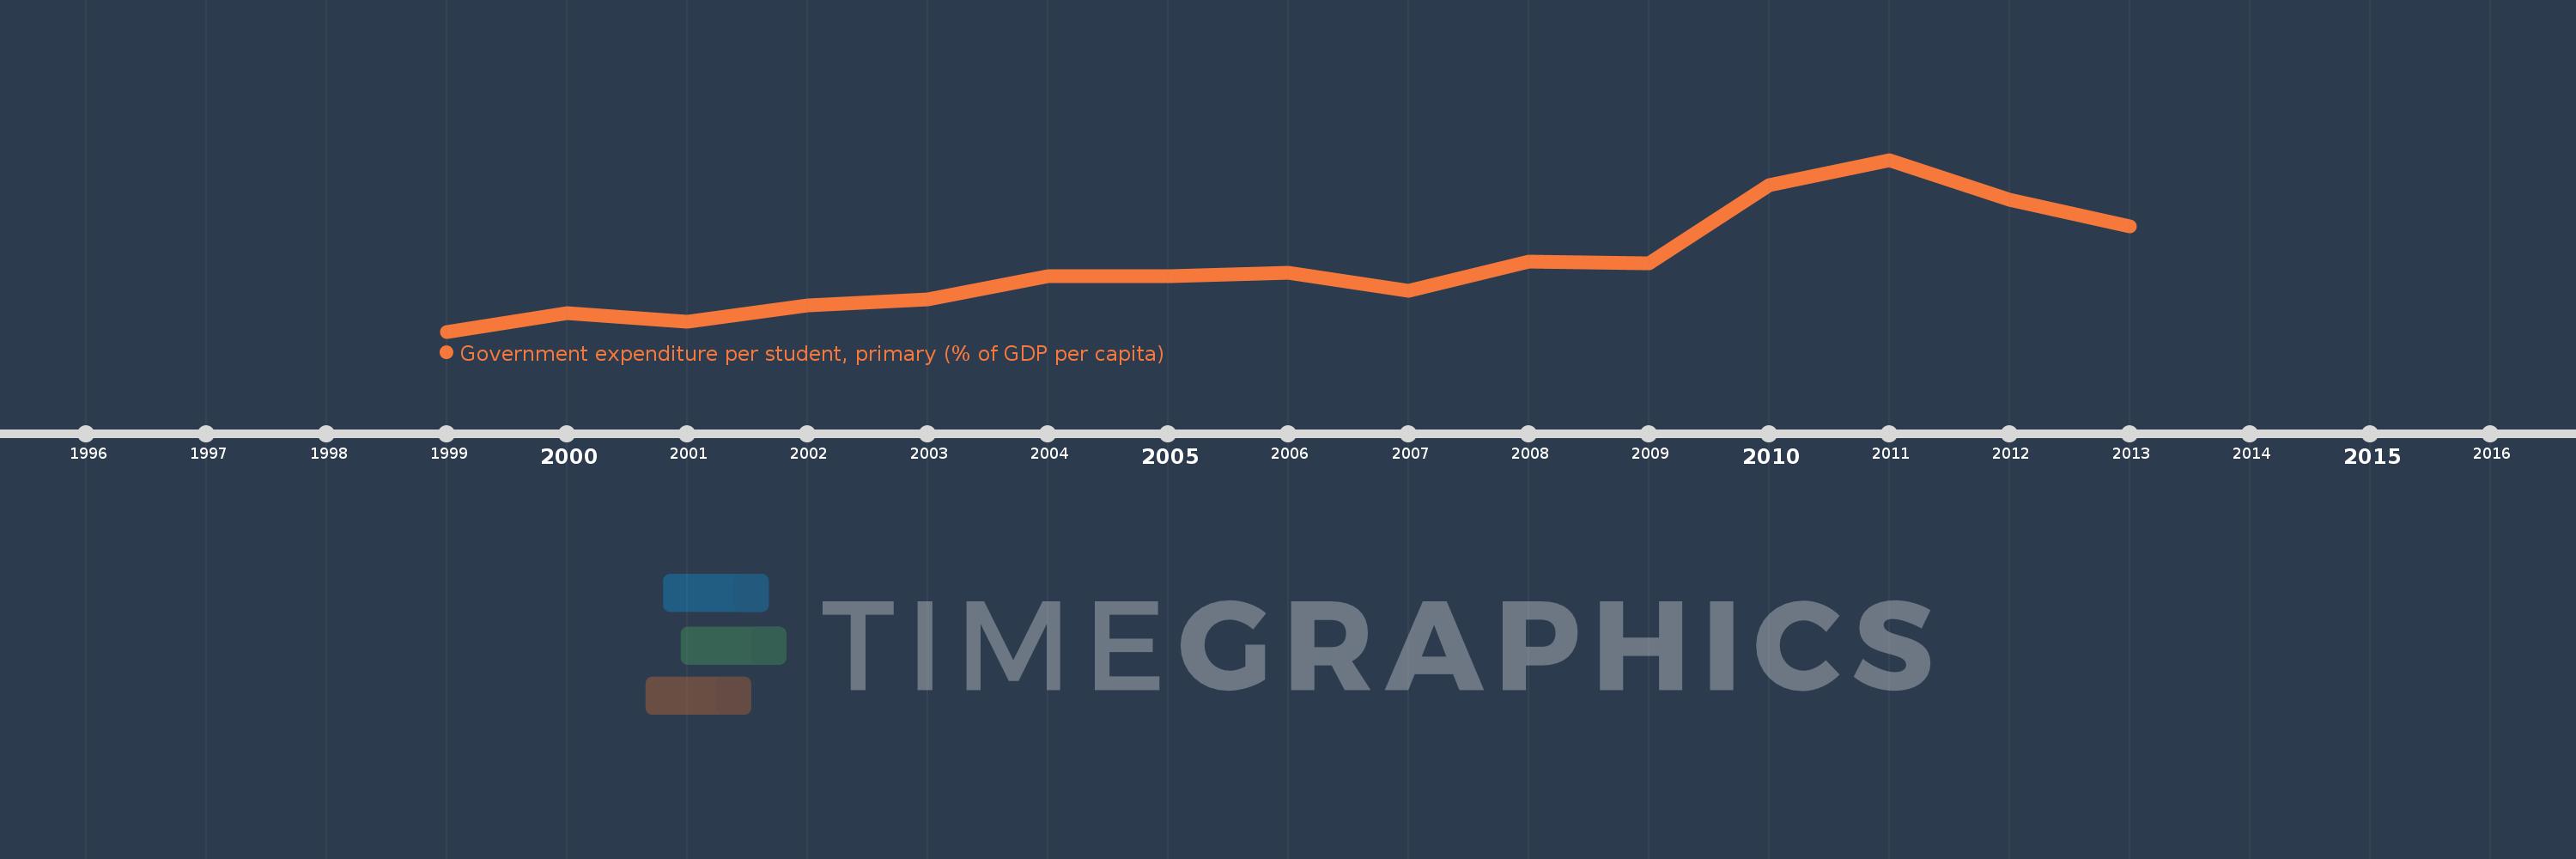
Government expenditure per student, primary (% of GDP per capita)
2013,2012,2011,2010,2009,2008,2007,2006,2005,2004,2003,2002,2001,2000,1999
This statistics in other country:
Timeline:
This timeline shows a graph from 1999 to 2013 of Euro area. No data until 1998. Number of actual observations by date: 15.
Source name:
World Development Indicators
Source organization:
United Nations Educational, Scientific, and Cultural Organization (UNESCO) Institute for Statistics.
Categories, topics:
Education
Last updated:
apr 23, 2017
Indicators value changes by year
Minimum:
16.984
jan 1, 1999
Maximum:
22.019
jan 1, 2011
At the date of observation
Value
Absolute change
Change from previous value
jan 1, 1999
16.984
+16.984
0.0%
jan 1, 2000
17.53
+0.546
3.22%
jan 1, 2001
17.273
-0.258
-1.47%
jan 1, 2002
17.755
+0.482
2.79%
jan 1, 2003
17.926
+0.171
0.96%
jan 1, 2004
18.613
+0.687
3.83%
jan 1, 2005
18.62
+0.008
0.04%
jan 1, 2006
18.7
+0.08
0.43%
jan 1, 2007
18.173
-0.528
-2.82%
jan 1, 2008
19.041
+0.868
4.78%
jan 1, 2009
18.973
-0.067
-0.35%
jan 1, 2010
21.276
+2.303
12.14%
jan 1, 2011
22.019
+0.743
3.49%
jan 1, 2012
20.86
-1.159
-5.26%
jan 1, 2013
20.079
-0.781
-3.75%
Ranking of countries by current statistics by years


Comments: