29
/
en
AIzaSyAYiBZKx7MnpbEhh9jyipgxe19OcubqV5w
April 1, 2024
85265
Bermuda
BMU
true
2
1
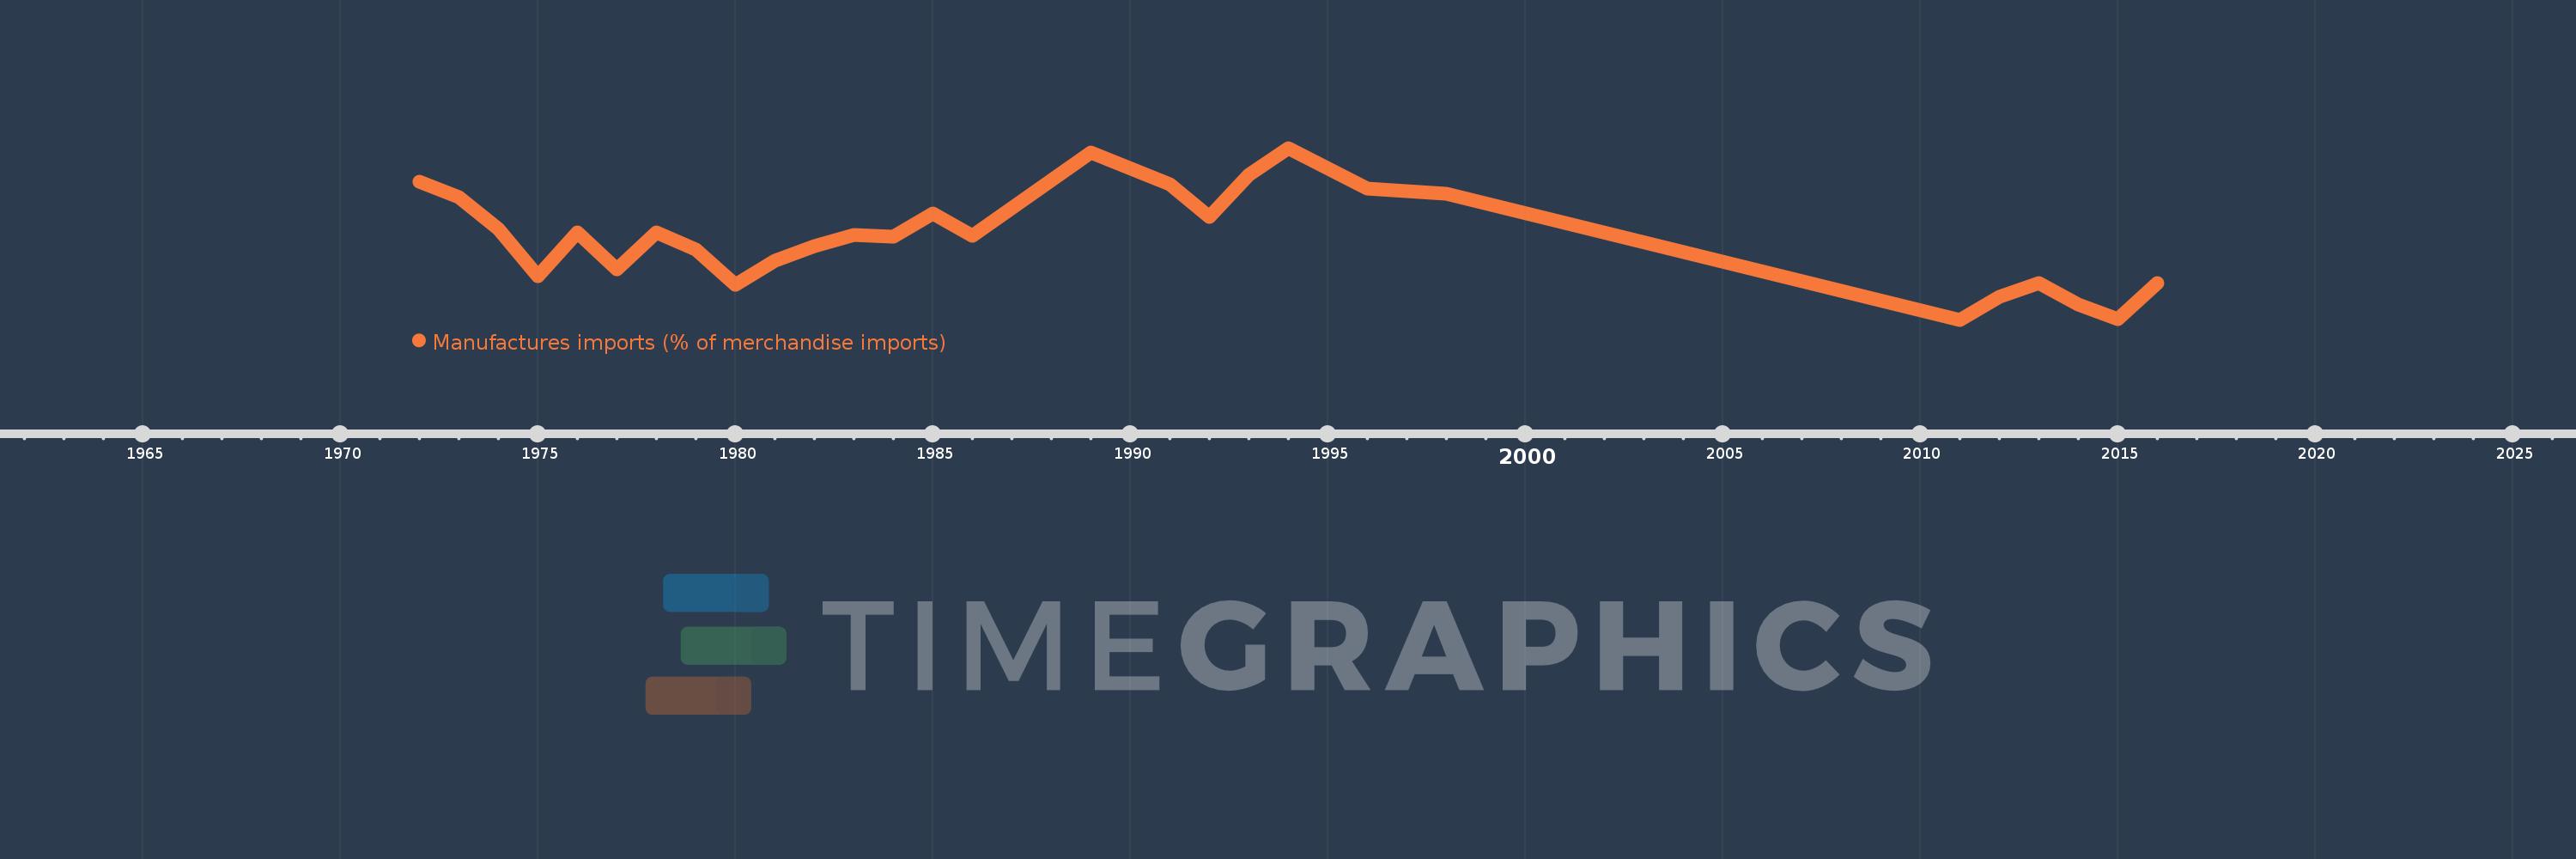
Manufactures imports (% of merchandise imports)
2016,2015,2014,2013,2012,2011,1998,1996,1994,1993,1992,1991,1989,1986,1985,1984,1983,1982,1981,1980,1979,1978,1977,1976,1975,1974,1973,1972
This statistics in other country:
AfghanistanAlbaniaAlgeriaAndorraAngolaAntigua and BarbudaArab WorldArgentinaArmeniaArubaAustraliaAustriaAzerbaijanBahamas, TheBahrainBangladeshBarbadosBelarusBelgiumBelizeBeninBermudaBhutanBoliviaBosnia and HerzegovinaBotswanaBrazilBrunei DarussalamBulgariaBurkina FasoBurundiCabo VerdeCambodiaCameroonCanadaCaribbean small statesCayman IslandsCentral African RepublicCentral Europe and the BalticsChadChileChinaColombiaComorosCongo, Dem. Rep.Congo, Rep.Costa RicaCote d'IvoireCroatiaCubaCyprusCzech RepublicDenmarkDjiboutiDominicaDominican RepublicEarly-demographic dividendEast Asia & PacificEast Asia & Pacific (excluding high income)East Asia & Pacific (IDA & IBRD countries)EcuadorEgypt, Arab Rep.El SalvadorEquatorial GuineaEritreaEstoniaEthiopiaEuro areaEurope & Central AsiaEurope & Central Asia (excluding high income)Europe & Central Asia (IDA & IBRD countries)European UnionFaroe IslandsFijiFinlandFragile and conflict affected situationsFranceFrench PolynesiaGabonGambia, TheGeorgiaGermanyGhanaGreeceGreenlandGrenadaGuatemalaGuineaGuinea-BissauGuyanaHaitiHeavily indebted poor countries (HIPC)High incomeHondurasHong Kong SAR, ChinaHungaryIBRD onlyIcelandIDA & IBRD totalIDA blendIDA onlyIDA totalIndiaIndonesiaIran, Islamic Rep.IraqIrelandIsraelItalyJamaicaJapanJordanKazakhstanKenyaKiribatiKorea, Rep.KuwaitKyrgyz RepublicLao PDRLate-demographic dividendLatin America & Caribbean Latin America & Caribbean (excluding high income)Latin America & the Caribbean (IDA & IBRD countries)LatviaLeast developed countries: UN classificationLebanonLesothoLiberiaLibyaLithuaniaLow & middle incomeLow incomeLower middle incomeLuxembourgMacao SAR, ChinaMacedonia, FYRMadagascarMalawiMalaysiaMaldivesMaliMaltaMauritaniaMauritiusMexicoMiddle East & North AfricaMiddle East & North Africa (excluding high income)Middle East & North Africa (IDA & IBRD countries)Middle incomeMoldovaMongoliaMoroccoMozambiqueMyanmarNamibiaNepalNetherlandsNew CaledoniaNew ZealandNicaraguaNigerNigeriaNorth AmericaNorwayOECD membersOmanOther small statesPacific island small statesPakistanPalauPanamaPapua New GuineaParaguayPeruPhilippinesPolandPortugalPost-demographic dividendPre-demographic dividendQatarRomaniaRussian FederationRwandaSamoaSao Tome and PrincipeSaudi ArabiaSenegalSerbiaSeychellesSierra LeoneSingaporeSlovak RepublicSloveniaSmall statesSolomon IslandsSomaliaSouth AfricaSouth AsiaSouth Asia (IDA & IBRD)SpainSri LankaSt. Kitts and NevisSt. LuciaSt. Vincent and the GrenadinesSub-Saharan Africa Sub-Saharan Africa (excluding high income)Sub-Saharan Africa (IDA & IBRD countries)SudanSurinameSwazilandSwedenSwitzerlandSyrian Arab RepublicTajikistanTanzaniaThailandTimor-LesteTogoTongaTrinidad and TobagoTunisiaTurkeyTurkmenistanTurks and Caicos IslandsTuvaluUgandaUkraineUnited Arab EmiratesUnited KingdomUnited StatesUpper middle incomeUruguayVanuatuVenezuela, RBVietnamVirgin Islands (U.S.)WorldYemen, Rep.ZambiaZimbabwe Timeline:
This timeline shows a graph from 1972 to 2016 of Bermuda. No data until 1971. Number of actual observations by date: 28.
Source name:
World Development Indicators
Source organization:
World Bank staff estimates from the Comtrade database maintained by the United Nations Statistics Division.
Categories, topics:
Private Sector, Trade
Last updated:
apr 23, 2017
Indicators value changes by year
Minimum:
50.548
jan 1, 2011
Maximum:
72.179
jan 1, 1994
At the date of observation
Value
Absolute change
Change from previous value
jan 1, 1972
67.965
+67.965
0.0%
jan 1, 1973
66.015
-1.95
-2.87%
jan 1, 1974
61.977
-4.038
-6.12%
jan 1, 1975
55.98
-5.997
-9.68%
jan 1, 1976
61.494
+5.514
9.85%
jan 1, 1977
56.912
-4.582
-7.45%
jan 1, 1978
61.577
+4.665
8.2%
jan 1, 1979
59.417
-2.16
-3.51%
jan 1, 1980
54.908
-4.509
-7.59%
jan 1, 1981
58.012
+3.104
5.65%
jan 1, 1982
59.822
+1.81
3.12%
jan 1, 1983
61.236
+1.414
2.36%
jan 1, 1984
61.021
-0.215
-0.35%
jan 1, 1985
63.884
+2.863
4.69%
jan 1, 1986
61.138
-2.747
-4.3%
jan 1, 1989
71.608
+10.47
17.13%
jan 1, 1991
67.57
-4.037
-5.64%
jan 1, 1992
63.463
-4.107
-6.08%
jan 1, 1993
68.751
+5.288
8.33%
jan 1, 1994
72.179
+3.428
4.99%
jan 1, 1996
67.044
-5.135
-7.11%
jan 1, 1998
66.394
-0.651
-0.97%
jan 1, 2011
50.548
-15.845
-23.87%
jan 1, 2012
53.461
+2.913
5.76%
jan 1, 2013
55.196
+1.735
3.25%
jan 1, 2014
52.504
-2.692
-4.88%
jan 1, 2015
50.608
-1.897
-3.61%
jan 1, 2016
55.176
+4.569
9.03%
Ranking of countries by current statistics by years


Comments: