29
/
en
AIzaSyAYiBZKx7MnpbEhh9jyipgxe19OcubqV5w
April 1, 2024
54964
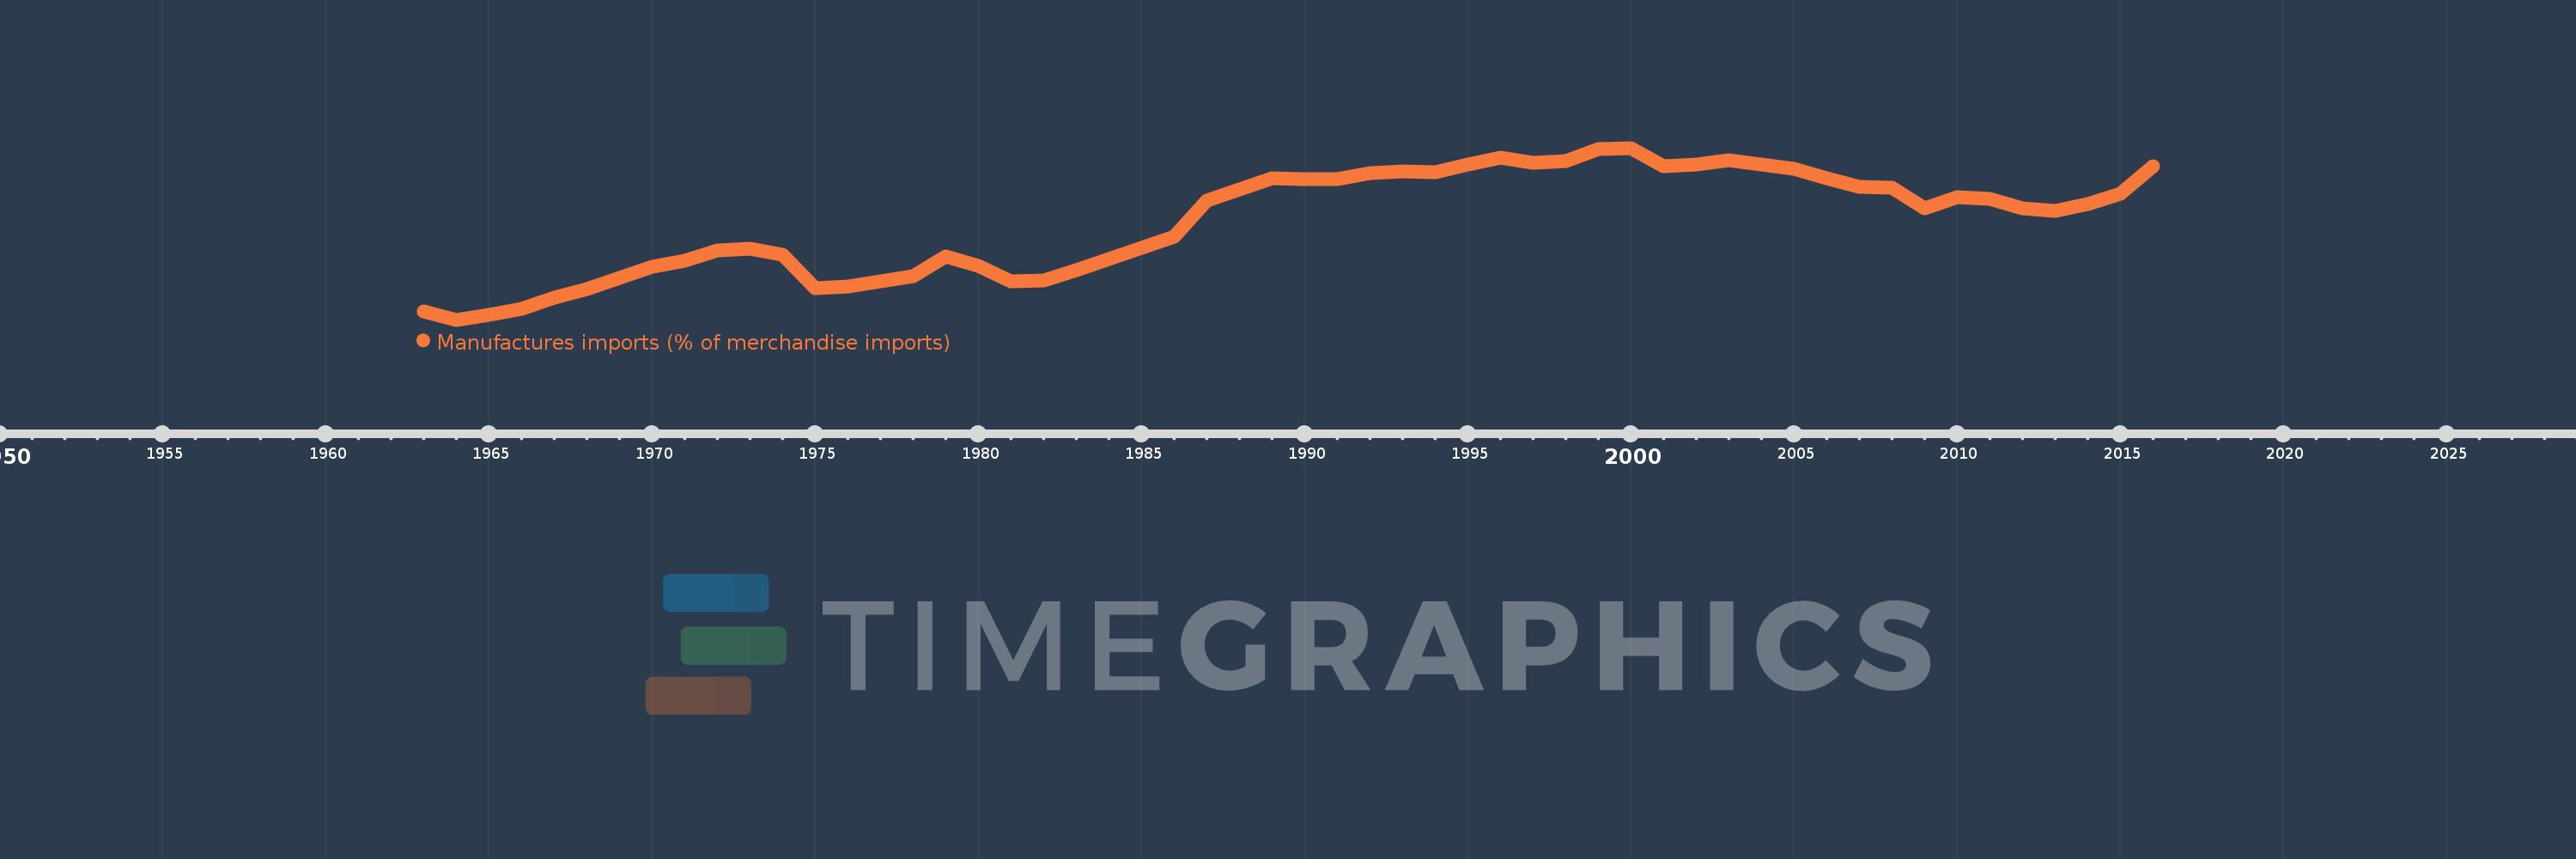
Post-demographic dividend
PST
false
2
1
Manufactures imports (% of merchandise imports)
2016,2015,2014,2013,2012,2011,2010,2009,2008,2007,2006,2005,2004,2003,2002,2001,2000,1999,1998,1997,1996,1995,1994,1993,1992,1991,1990,1989,1988,1987,1986,1985,1984,1983,1982,1981,1980,1979,1978,1977,1976,1975,1974,1973,1972,1971,1970,1969,1968,1967,1966,1965,1964,1963
This statistics in other country:
AfghanistanAlbaniaAlgeriaAndorraAngolaAntigua and BarbudaArab WorldArgentinaArmeniaArubaAustraliaAustriaAzerbaijanBahamas, TheBahrainBangladeshBarbadosBelarusBelgiumBelizeBeninBermudaBhutanBoliviaBosnia and HerzegovinaBotswanaBrazilBrunei DarussalamBulgariaBurkina FasoBurundiCabo VerdeCambodiaCameroonCanadaCaribbean small statesCayman IslandsCentral African RepublicCentral Europe and the BalticsChadChileChinaColombiaComorosCongo, Dem. Rep.Congo, Rep.Costa RicaCote d'IvoireCroatiaCubaCyprusCzech RepublicDenmarkDjiboutiDominicaDominican RepublicEarly-demographic dividendEast Asia & PacificEast Asia & Pacific (excluding high income)East Asia & Pacific (IDA & IBRD countries)EcuadorEgypt, Arab Rep.El SalvadorEquatorial GuineaEritreaEstoniaEthiopiaEuro areaEurope & Central AsiaEurope & Central Asia (excluding high income)Europe & Central Asia (IDA & IBRD countries)European UnionFaroe IslandsFijiFinlandFragile and conflict affected situationsFranceFrench PolynesiaGabonGambia, TheGeorgiaGermanyGhanaGreeceGreenlandGrenadaGuatemalaGuineaGuinea-BissauGuyanaHaitiHeavily indebted poor countries (HIPC)High incomeHondurasHong Kong SAR, ChinaHungaryIBRD onlyIcelandIDA & IBRD totalIDA blendIDA onlyIDA totalIndiaIndonesiaIran, Islamic Rep.IraqIrelandIsraelItalyJamaicaJapanJordanKazakhstanKenyaKiribatiKorea, Rep.KuwaitKyrgyz RepublicLao PDRLate-demographic dividendLatin America & Caribbean Latin America & Caribbean (excluding high income)Latin America & the Caribbean (IDA & IBRD countries)LatviaLeast developed countries: UN classificationLebanonLesothoLiberiaLibyaLithuaniaLow & middle incomeLow incomeLower middle incomeLuxembourgMacao SAR, ChinaMacedonia, FYRMadagascarMalawiMalaysiaMaldivesMaliMaltaMauritaniaMauritiusMexicoMiddle East & North AfricaMiddle East & North Africa (excluding high income)Middle East & North Africa (IDA & IBRD countries)Middle incomeMoldovaMongoliaMoroccoMozambiqueMyanmarNamibiaNepalNetherlandsNew CaledoniaNew ZealandNicaraguaNigerNigeriaNorth AmericaNorwayOECD membersOmanOther small statesPacific island small statesPakistanPalauPanamaPapua New GuineaParaguayPeruPhilippinesPolandPortugalPost-demographic dividendPre-demographic dividendQatarRomaniaRussian FederationRwandaSamoaSao Tome and PrincipeSaudi ArabiaSenegalSerbiaSeychellesSierra LeoneSingaporeSlovak RepublicSloveniaSmall statesSolomon IslandsSomaliaSouth AfricaSouth AsiaSouth Asia (IDA & IBRD)SpainSri LankaSt. Kitts and NevisSt. LuciaSt. Vincent and the GrenadinesSub-Saharan Africa Sub-Saharan Africa (excluding high income)Sub-Saharan Africa (IDA & IBRD countries)SudanSurinameSwazilandSwedenSwitzerlandSyrian Arab RepublicTajikistanTanzaniaThailandTimor-LesteTogoTongaTrinidad and TobagoTunisiaTurkeyTurkmenistanTurks and Caicos IslandsTuvaluUgandaUkraineUnited Arab EmiratesUnited KingdomUnited StatesUpper middle incomeUruguayVanuatuVenezuela, RBVietnamVirgin Islands (U.S.)WorldYemen, Rep.ZambiaZimbabwe Timeline:
This timeline shows a graph from 1963 to 2016 of Post-demographic dividend. No data until 1962. Number of actual observations by date: 54.
Source name:
World Development Indicators
Source organization:
World Bank staff estimates from the Comtrade database maintained by the United Nations Statistics Division.
Categories, topics:
Private Sector, Trade
Last updated:
apr 23, 2017
Indicators value changes by year
Minimum:
45.523
jan 1, 1964
Maximum:
77.072
jan 1, 2000
At the date of observation
Value
Absolute change
Change from previous value
jan 1, 1963
47.116
+47.116
0.0%
jan 1, 1964
45.523
-1.594
-3.38%
jan 1, 1965
46.485
+0.963
2.11%
jan 1, 1966
47.51
+1.025
2.2%
jan 1, 1967
49.624
+2.114
4.45%
jan 1, 1968
51.123
+1.499
3.02%
jan 1, 1969
53.262
+2.139
4.18%
jan 1, 1970
55.207
+1.945
3.65%
jan 1, 1971
56.298
+1.091
1.98%
jan 1, 1972
58.238
+1.939
3.44%
jan 1, 1973
58.501
+0.263
0.45%
jan 1, 1974
57.427
-1.074
-1.84%
jan 1, 1975
51.288
-6.139
-10.69%
jan 1, 1976
51.655
+0.367
0.72%
jan 1, 1977
52.648
+0.993
1.92%
jan 1, 1978
53.542
+0.894
1.7%
jan 1, 1979
57.13
+3.588
6.7%
jan 1, 1980
55.346
-1.784
-3.12%
jan 1, 1981
52.589
-2.756
-4.98%
jan 1, 1982
52.695
+0.105
0.2%
jan 1, 1983
54.56
+1.865
3.54%
jan 1, 1984
56.731
+2.171
3.98%
jan 1, 1985
58.708
+1.977
3.49%
jan 1, 1986
60.739
+2.031
3.46%
jan 1, 1987
67.423
+6.685
11.01%
jan 1, 1988
69.393
+1.969
2.92%
jan 1, 1989
71.459
+2.067
2.98%
jan 1, 1990
71.309
-0.151
-0.21%
jan 1, 1991
71.391
+0.082
0.12%
jan 1, 1992
72.431
+1.04
1.46%
jan 1, 1993
72.791
+0.36
0.5%
jan 1, 1994
72.64
-0.151
-0.21%
jan 1, 1995
74.097
+1.457
2.01%
jan 1, 1996
75.249
+1.152
1.55%
jan 1, 1997
74.357
-0.892
-1.19%
jan 1, 1998
74.736
+0.379
0.51%
jan 1, 1999
76.91
+2.174
2.91%
jan 1, 2000
77.072
+0.161
0.21%
jan 1, 2001
73.651
-3.42
-4.44%
jan 1, 2002
74.092
+0.441
0.6%
jan 1, 2003
74.826
+0.734
0.99%
jan 1, 2004
74.061
-0.765
-1.02%
jan 1, 2005
73.248
-0.812
-1.1%
jan 1, 2006
71.562
-1.686
-2.3%
jan 1, 2007
69.872
-1.69
-2.36%
jan 1, 2008
69.711
-0.161
-0.23%
jan 1, 2009
65.93
-3.781
-5.42%
jan 1, 2010
68.031
+2.101
3.19%
jan 1, 2011
67.779
-0.253
-0.37%
jan 1, 2012
65.971
-1.808
-2.67%
jan 1, 2013
65.559
-0.411
-0.62%
jan 1, 2014
66.816
+1.257
1.92%
jan 1, 2015
68.616
+1.8
2.69%
jan 1, 2016
73.735
+5.119
7.46%
Ranking of countries by current statistics by years


Comments: