29
/
en
AIzaSyAYiBZKx7MnpbEhh9jyipgxe19OcubqV5w
April 1, 2024
100175
Cameroon
CMR
true
2
1
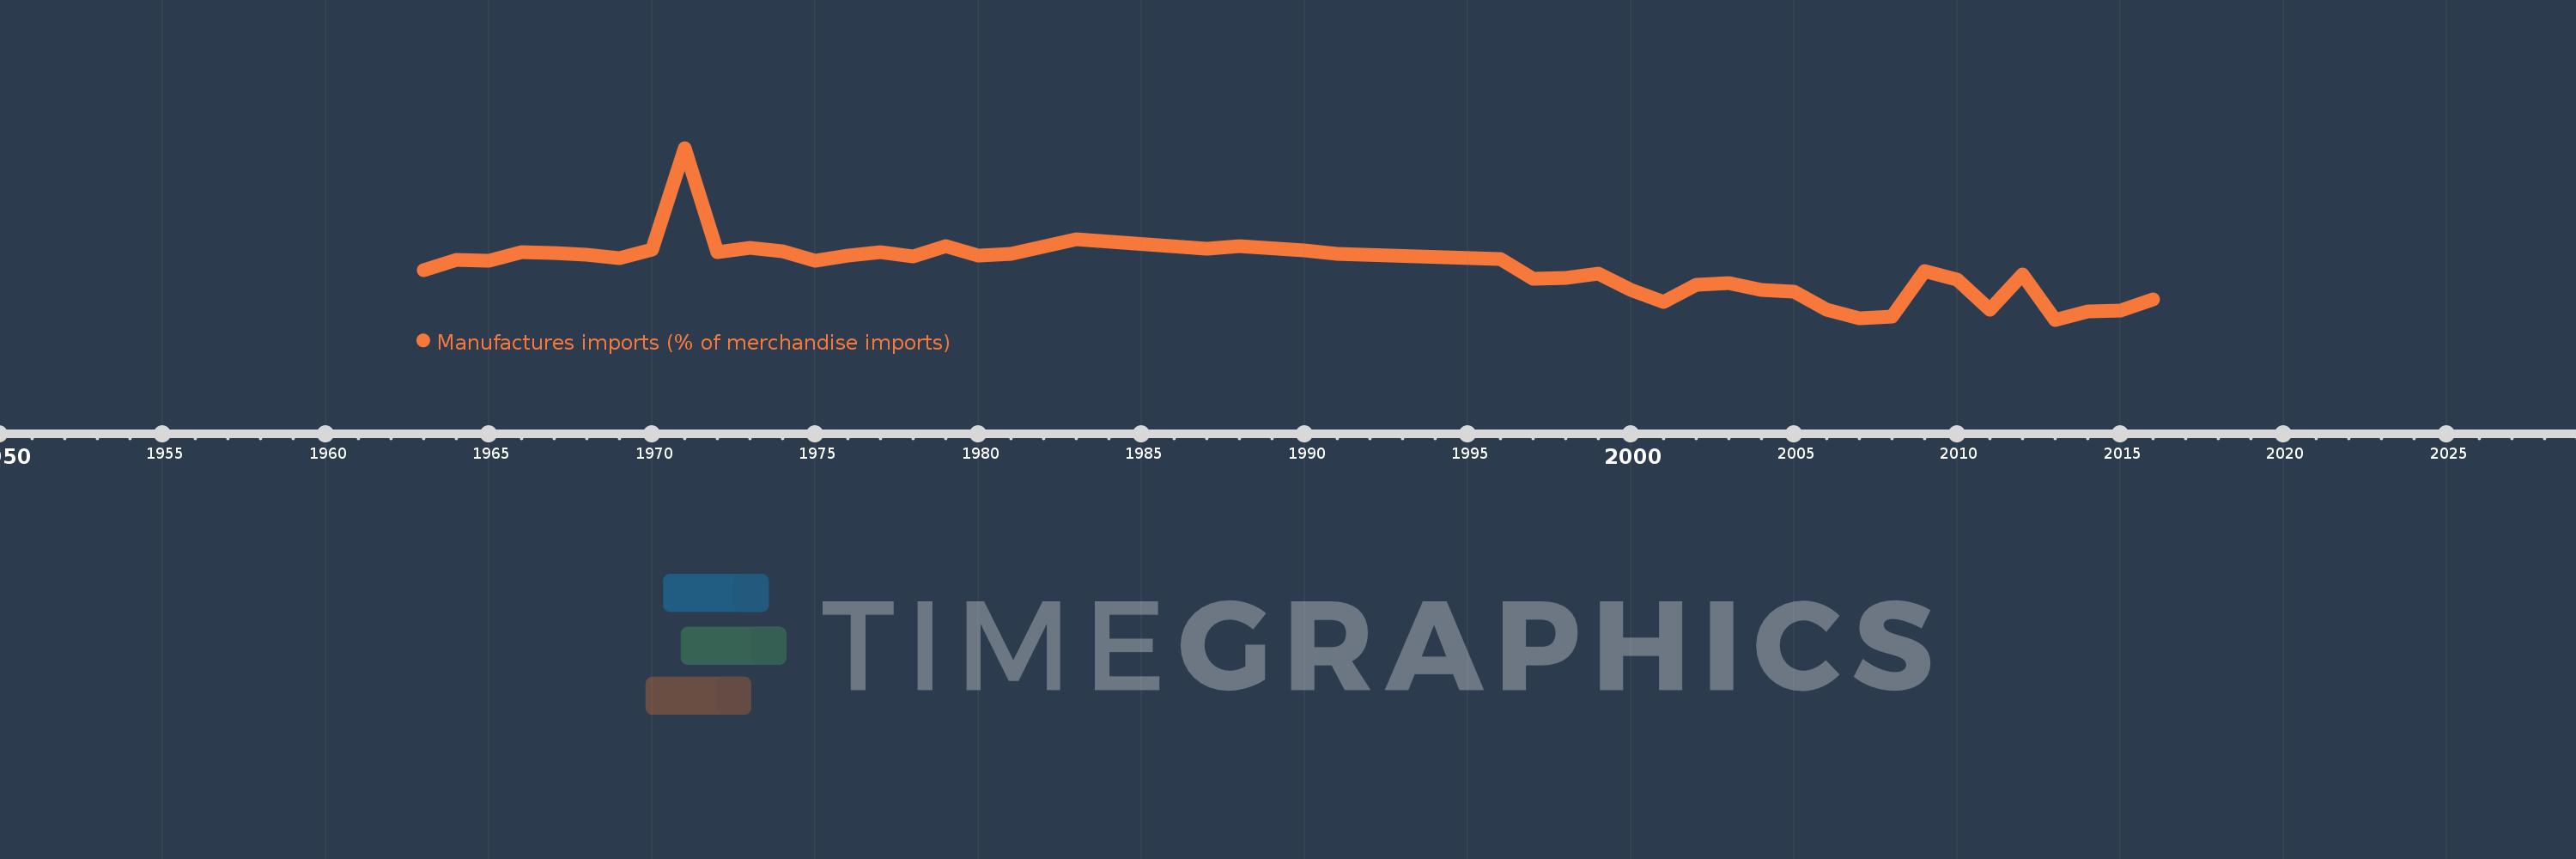
Manufactures imports (% of merchandise imports)
2016,2015,2014,2013,2012,2011,2010,2009,2008,2007,2006,2005,2004,2003,2002,2001,2000,1999,1998,1997,1996,1991,1990,1988,1987,1983,1981,1980,1979,1978,1977,1976,1975,1974,1973,1972,1971,1970,1969,1968,1967,1966,1965,1964,1963
This statistics in other country:
AfghanistanAlbaniaAlgeriaAndorraAngolaAntigua and BarbudaArab WorldArgentinaArmeniaArubaAustraliaAustriaAzerbaijanBahamas, TheBahrainBangladeshBarbadosBelarusBelgiumBelizeBeninBermudaBhutanBoliviaBosnia and HerzegovinaBotswanaBrazilBrunei DarussalamBulgariaBurkina FasoBurundiCabo VerdeCambodiaCameroonCanadaCaribbean small statesCayman IslandsCentral African RepublicCentral Europe and the BalticsChadChileChinaColombiaComorosCongo, Dem. Rep.Congo, Rep.Costa RicaCote d'IvoireCroatiaCubaCyprusCzech RepublicDenmarkDjiboutiDominicaDominican RepublicEarly-demographic dividendEast Asia & PacificEast Asia & Pacific (excluding high income)East Asia & Pacific (IDA & IBRD countries)EcuadorEgypt, Arab Rep.El SalvadorEquatorial GuineaEritreaEstoniaEthiopiaEuro areaEurope & Central AsiaEurope & Central Asia (excluding high income)Europe & Central Asia (IDA & IBRD countries)European UnionFaroe IslandsFijiFinlandFragile and conflict affected situationsFranceFrench PolynesiaGabonGambia, TheGeorgiaGermanyGhanaGreeceGreenlandGrenadaGuatemalaGuineaGuinea-BissauGuyanaHaitiHeavily indebted poor countries (HIPC)High incomeHondurasHong Kong SAR, ChinaHungaryIBRD onlyIcelandIDA & IBRD totalIDA blendIDA onlyIDA totalIndiaIndonesiaIran, Islamic Rep.IraqIrelandIsraelItalyJamaicaJapanJordanKazakhstanKenyaKiribatiKorea, Rep.KuwaitKyrgyz RepublicLao PDRLate-demographic dividendLatin America & Caribbean Latin America & Caribbean (excluding high income)Latin America & the Caribbean (IDA & IBRD countries)LatviaLeast developed countries: UN classificationLebanonLesothoLiberiaLibyaLithuaniaLow & middle incomeLow incomeLower middle incomeLuxembourgMacao SAR, ChinaMacedonia, FYRMadagascarMalawiMalaysiaMaldivesMaliMaltaMauritaniaMauritiusMexicoMiddle East & North AfricaMiddle East & North Africa (excluding high income)Middle East & North Africa (IDA & IBRD countries)Middle incomeMoldovaMongoliaMoroccoMozambiqueMyanmarNamibiaNepalNetherlandsNew CaledoniaNew ZealandNicaraguaNigerNigeriaNorth AmericaNorwayOECD membersOmanOther small statesPacific island small statesPakistanPalauPanamaPapua New GuineaParaguayPeruPhilippinesPolandPortugalPost-demographic dividendPre-demographic dividendQatarRomaniaRussian FederationRwandaSamoaSao Tome and PrincipeSaudi ArabiaSenegalSerbiaSeychellesSierra LeoneSingaporeSlovak RepublicSloveniaSmall statesSolomon IslandsSomaliaSouth AfricaSouth AsiaSouth Asia (IDA & IBRD)SpainSri LankaSt. Kitts and NevisSt. LuciaSt. Vincent and the GrenadinesSub-Saharan Africa Sub-Saharan Africa (excluding high income)Sub-Saharan Africa (IDA & IBRD countries)SudanSurinameSwazilandSwedenSwitzerlandSyrian Arab RepublicTajikistanTanzaniaThailandTimor-LesteTogoTongaTrinidad and TobagoTunisiaTurkeyTurkmenistanTurks and Caicos IslandsTuvaluUgandaUkraineUnited Arab EmiratesUnited KingdomUnited StatesUpper middle incomeUruguayVanuatuVenezuela, RBVietnamVirgin Islands (U.S.)WorldYemen, Rep.ZambiaZimbabwe Timeline:
This timeline shows a graph from 1963 to 2016 of Cameroon. No data until 1962. Number of actual observations by date: 45.
Source name:
World Development Indicators
Source organization:
World Bank staff estimates from the Comtrade database maintained by the United Nations Statistics Division.
Categories, topics:
Private Sector, Trade
Last updated:
apr 23, 2017
Indicators value changes by year
Minimum:
47.946
jan 1, 2013
Maximum:
126.32
jan 1, 1971
At the date of observation
Value
Absolute change
Change from previous value
jan 1, 1963
70.664
+70.664
0.0%
jan 1, 1964
75.455
+4.791
6.78%
jan 1, 1965
74.841
-0.614
-0.81%
jan 1, 1966
78.766
+3.925
5.24%
jan 1, 1967
78.357
-0.409
-0.52%
jan 1, 1968
77.688
-0.669
-0.85%
jan 1, 1969
75.96
-1.728
-2.22%
jan 1, 1970
79.922
+3.962
5.22%
jan 1, 1971
126.32
+46.398
58.05%
jan 1, 1972
78.608
-47.712
-37.77%
jan 1, 1973
80.565
+1.957
2.49%
jan 1, 1974
79.119
-1.446
-1.8%
jan 1, 1975
74.714
-4.404
-5.57%
jan 1, 1976
77.023
+2.309
3.09%
jan 1, 1977
78.634
+1.611
2.09%
jan 1, 1978
76.724
-1.911
-2.43%
jan 1, 1979
81.338
+4.615
6.01%
jan 1, 1980
77.086
-4.252
-5.23%
jan 1, 1981
78.036
+0.951
1.23%
jan 1, 1983
84.586
+6.55
8.39%
jan 1, 1987
80.266
-4.32
-5.11%
jan 1, 1988
81.49
+1.225
1.53%
jan 1, 1990
79.556
-1.934
-2.37%
jan 1, 1991
78.003
-1.554
-1.95%
jan 1, 1996
75.636
-2.367
-3.03%
jan 1, 1997
66.724
-8.911
-11.78%
jan 1, 1998
67.113
+0.389
0.58%
jan 1, 1999
68.928
+1.815
2.7%
jan 1, 2000
61.35
-7.578
-10.99%
jan 1, 2001
55.921
-5.429
-8.85%
jan 1, 2002
63.886
+7.965
14.24%
jan 1, 2003
64.517
+0.631
0.99%
jan 1, 2004
61.669
-2.848
-4.41%
jan 1, 2005
60.919
-0.75
-1.22%
jan 1, 2006
52.45
-8.469
-13.9%
jan 1, 2007
48.432
-4.018
-7.66%
jan 1, 2008
49.447
+1.015
2.1%
jan 1, 2009
70.308
+20.86
42.19%
jan 1, 2010
66.259
-4.048
-5.76%
jan 1, 2011
52.426
-13.833
-20.88%
jan 1, 2012
68.761
+16.335
31.16%
jan 1, 2013
47.946
-20.816
-30.27%
jan 1, 2014
51.586
+3.64
7.59%
jan 1, 2015
52.29
+0.705
1.37%
jan 1, 2016
57.361
+5.07
9.7%
Ranking of countries by current statistics by years


Comments: