29
/
en
AIzaSyAYiBZKx7MnpbEhh9jyipgxe19OcubqV5w
April 1, 2024
27457
East Asia & Pacific
EAS
false
2
1
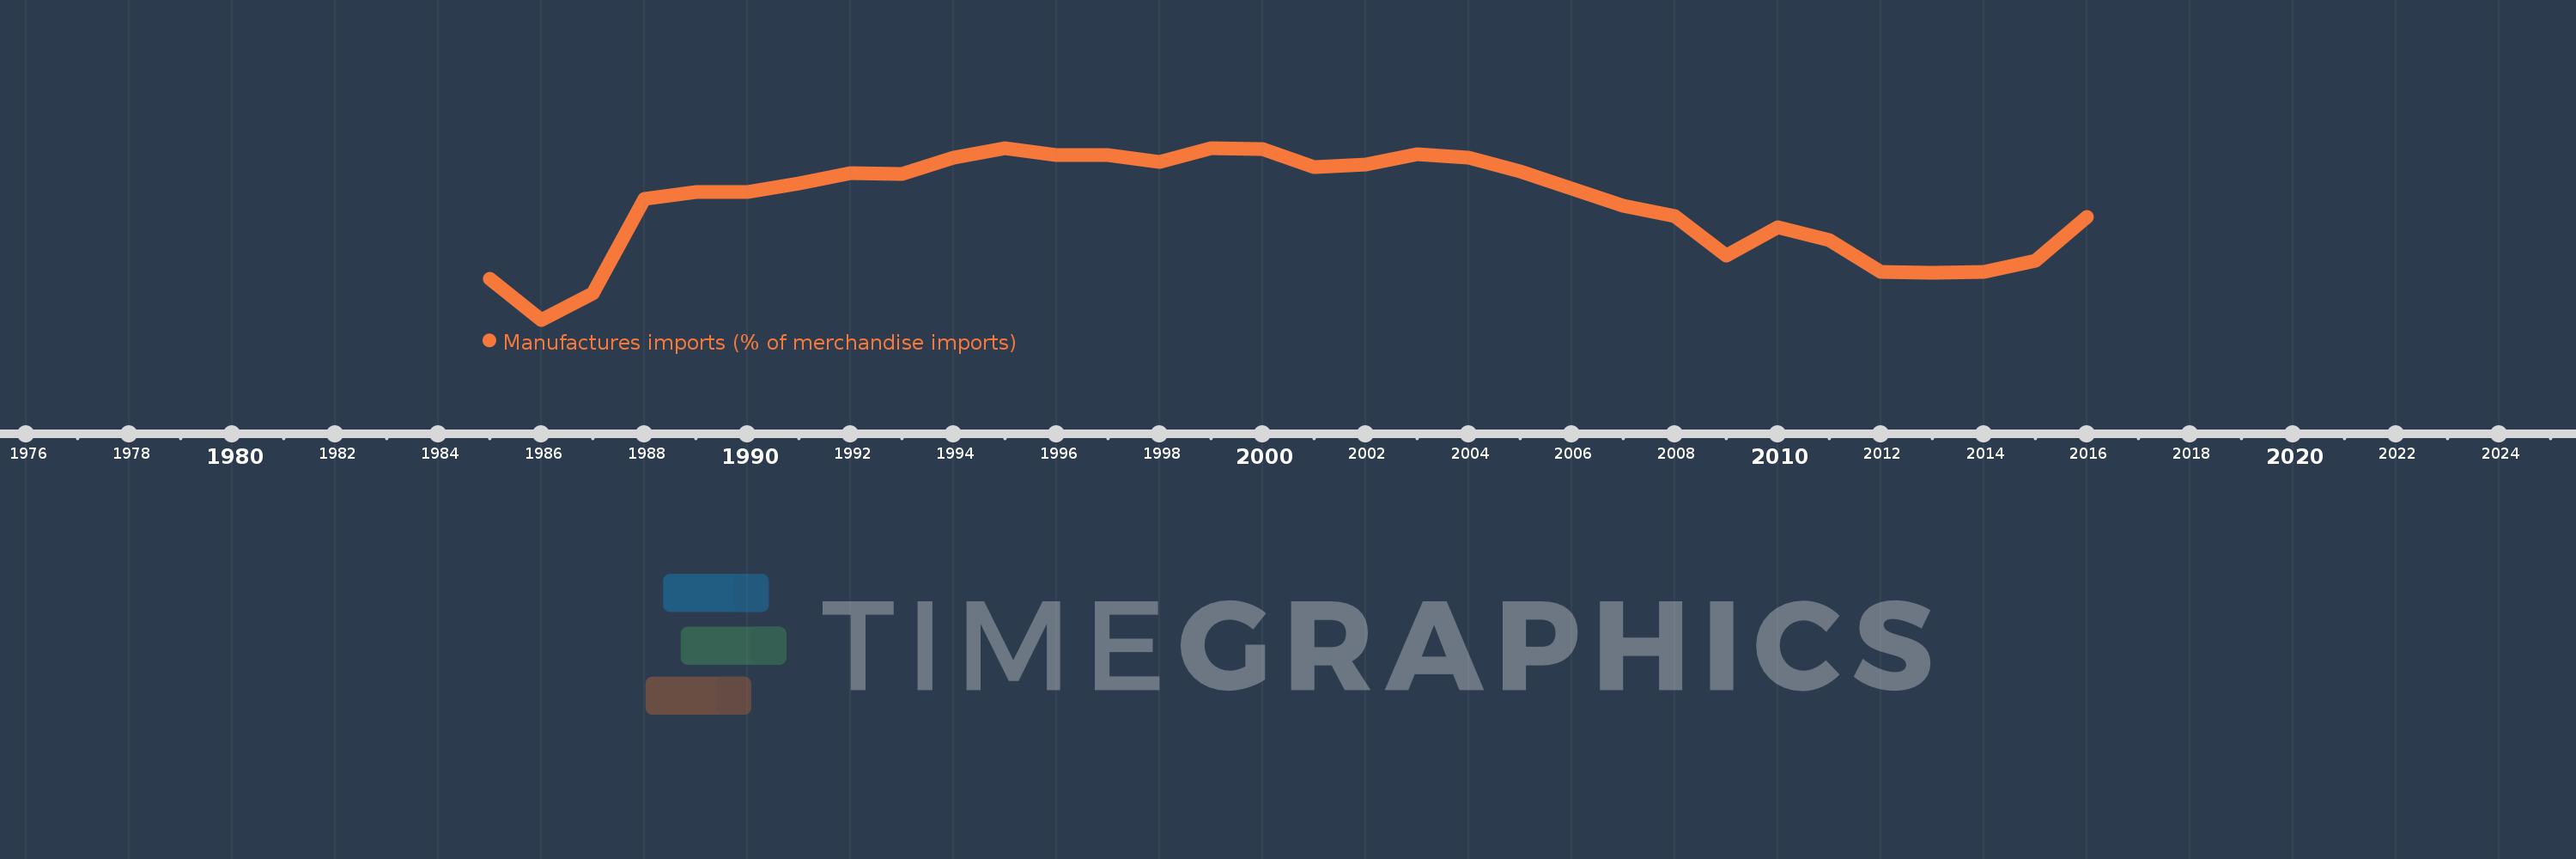
Manufactures imports (% of merchandise imports)
2016,2015,2014,2013,2012,2011,2010,2009,2008,2007,2006,2005,2004,2003,2002,2001,2000,1999,1998,1997,1996,1995,1994,1993,1992,1991,1990,1989,1988,1987,1986,1985
This statistics in other country:
AfghanistanAlbaniaAlgeriaAndorraAngolaAntigua and BarbudaArab WorldArgentinaArmeniaArubaAustraliaAustriaAzerbaijanBahamas, TheBahrainBangladeshBarbadosBelarusBelgiumBelizeBeninBermudaBhutanBoliviaBosnia and HerzegovinaBotswanaBrazilBrunei DarussalamBulgariaBurkina FasoBurundiCabo VerdeCambodiaCameroonCanadaCaribbean small statesCayman IslandsCentral African RepublicCentral Europe and the BalticsChadChileChinaColombiaComorosCongo, Dem. Rep.Congo, Rep.Costa RicaCote d'IvoireCroatiaCubaCyprusCzech RepublicDenmarkDjiboutiDominicaDominican RepublicEarly-demographic dividendEast Asia & PacificEast Asia & Pacific (excluding high income)East Asia & Pacific (IDA & IBRD countries)EcuadorEgypt, Arab Rep.El SalvadorEquatorial GuineaEritreaEstoniaEthiopiaEuro areaEurope & Central AsiaEurope & Central Asia (excluding high income)Europe & Central Asia (IDA & IBRD countries)European UnionFaroe IslandsFijiFinlandFragile and conflict affected situationsFranceFrench PolynesiaGabonGambia, TheGeorgiaGermanyGhanaGreeceGreenlandGrenadaGuatemalaGuineaGuinea-BissauGuyanaHaitiHeavily indebted poor countries (HIPC)High incomeHondurasHong Kong SAR, ChinaHungaryIBRD onlyIcelandIDA & IBRD totalIDA blendIDA onlyIDA totalIndiaIndonesiaIran, Islamic Rep.IraqIrelandIsraelItalyJamaicaJapanJordanKazakhstanKenyaKiribatiKorea, Rep.KuwaitKyrgyz RepublicLao PDRLate-demographic dividendLatin America & Caribbean Latin America & Caribbean (excluding high income)Latin America & the Caribbean (IDA & IBRD countries)LatviaLeast developed countries: UN classificationLebanonLesothoLiberiaLibyaLithuaniaLow & middle incomeLow incomeLower middle incomeLuxembourgMacao SAR, ChinaMacedonia, FYRMadagascarMalawiMalaysiaMaldivesMaliMaltaMauritaniaMauritiusMexicoMiddle East & North AfricaMiddle East & North Africa (excluding high income)Middle East & North Africa (IDA & IBRD countries)Middle incomeMoldovaMongoliaMoroccoMozambiqueMyanmarNamibiaNepalNetherlandsNew CaledoniaNew ZealandNicaraguaNigerNigeriaNorth AmericaNorwayOECD membersOmanOther small statesPacific island small statesPakistanPalauPanamaPapua New GuineaParaguayPeruPhilippinesPolandPortugalPost-demographic dividendPre-demographic dividendQatarRomaniaRussian FederationRwandaSamoaSao Tome and PrincipeSaudi ArabiaSenegalSerbiaSeychellesSierra LeoneSingaporeSlovak RepublicSloveniaSmall statesSolomon IslandsSomaliaSouth AfricaSouth AsiaSouth Asia (IDA & IBRD)SpainSri LankaSt. Kitts and NevisSt. LuciaSt. Vincent and the GrenadinesSub-Saharan Africa Sub-Saharan Africa (excluding high income)Sub-Saharan Africa (IDA & IBRD countries)SudanSurinameSwazilandSwedenSwitzerlandSyrian Arab RepublicTajikistanTanzaniaThailandTimor-LesteTogoTongaTrinidad and TobagoTunisiaTurkeyTurkmenistanTurks and Caicos IslandsTuvaluUgandaUkraineUnited Arab EmiratesUnited KingdomUnited StatesUpper middle incomeUruguayVanuatuVenezuela, RBVietnamVirgin Islands (U.S.)WorldYemen, Rep.ZambiaZimbabwe Timeline:
This timeline shows a graph from 1985 to 2016 of East Asia & Pacific. No data until 1984. Number of actual observations by date: 32.
Source name:
World Development Indicators
Source organization:
World Bank staff estimates from the Comtrade database maintained by the United Nations Statistics Division.
Categories, topics:
Private Sector, Trade
Last updated:
apr 23, 2017
Indicators value changes by year
Minimum:
54.486
jan 1, 1986
Maximum:
76.037
jan 1, 1995
At the date of observation
Value
Absolute change
Change from previous value
jan 1, 1985
59.663
+59.663
0.0%
jan 1, 1986
54.486
-5.176
-8.68%
jan 1, 1987
57.79
+3.304
6.06%
jan 1, 1988
69.643
+11.853
20.51%
jan 1, 1989
70.555
+0.911
1.31%
jan 1, 1990
70.475
-0.079
-0.11%
jan 1, 1991
71.582
+1.107
1.57%
jan 1, 1992
72.84
+1.258
1.76%
jan 1, 1993
72.775
-0.065
-0.09%
jan 1, 1994
74.825
+2.05
2.82%
jan 1, 1995
76.037
+1.212
1.62%
jan 1, 1996
75.187
-0.85
-1.12%
jan 1, 1997
75.106
-0.081
-0.11%
jan 1, 1998
74.231
-0.875
-1.16%
jan 1, 1999
76.006
+1.775
2.39%
jan 1, 2000
75.946
-0.06
-0.08%
jan 1, 2001
73.584
-2.362
-3.11%
jan 1, 2002
73.999
+0.415
0.56%
jan 1, 2003
75.211
+1.212
1.64%
jan 1, 2004
74.812
-0.399
-0.53%
jan 1, 2005
73.117
-1.695
-2.27%
jan 1, 2006
70.981
-2.136
-2.92%
jan 1, 2007
68.797
-2.185
-3.08%
jan 1, 2008
67.54
-1.256
-1.83%
jan 1, 2009
62.574
-4.966
-7.35%
jan 1, 2010
66.07
+3.496
5.59%
jan 1, 2011
64.502
-1.568
-2.37%
jan 1, 2012
60.469
-4.033
-6.25%
jan 1, 2013
60.339
-0.13
-0.22%
jan 1, 2014
60.477
+0.139
0.23%
jan 1, 2015
61.857
+1.379
2.28%
jan 1, 2016
67.401
+5.544
8.96%
Ranking of countries by current statistics by years


Comments: