29
/
en
AIzaSyAYiBZKx7MnpbEhh9jyipgxe19OcubqV5w
April 1, 2024
153769
Iceland
ISL
true
2
1
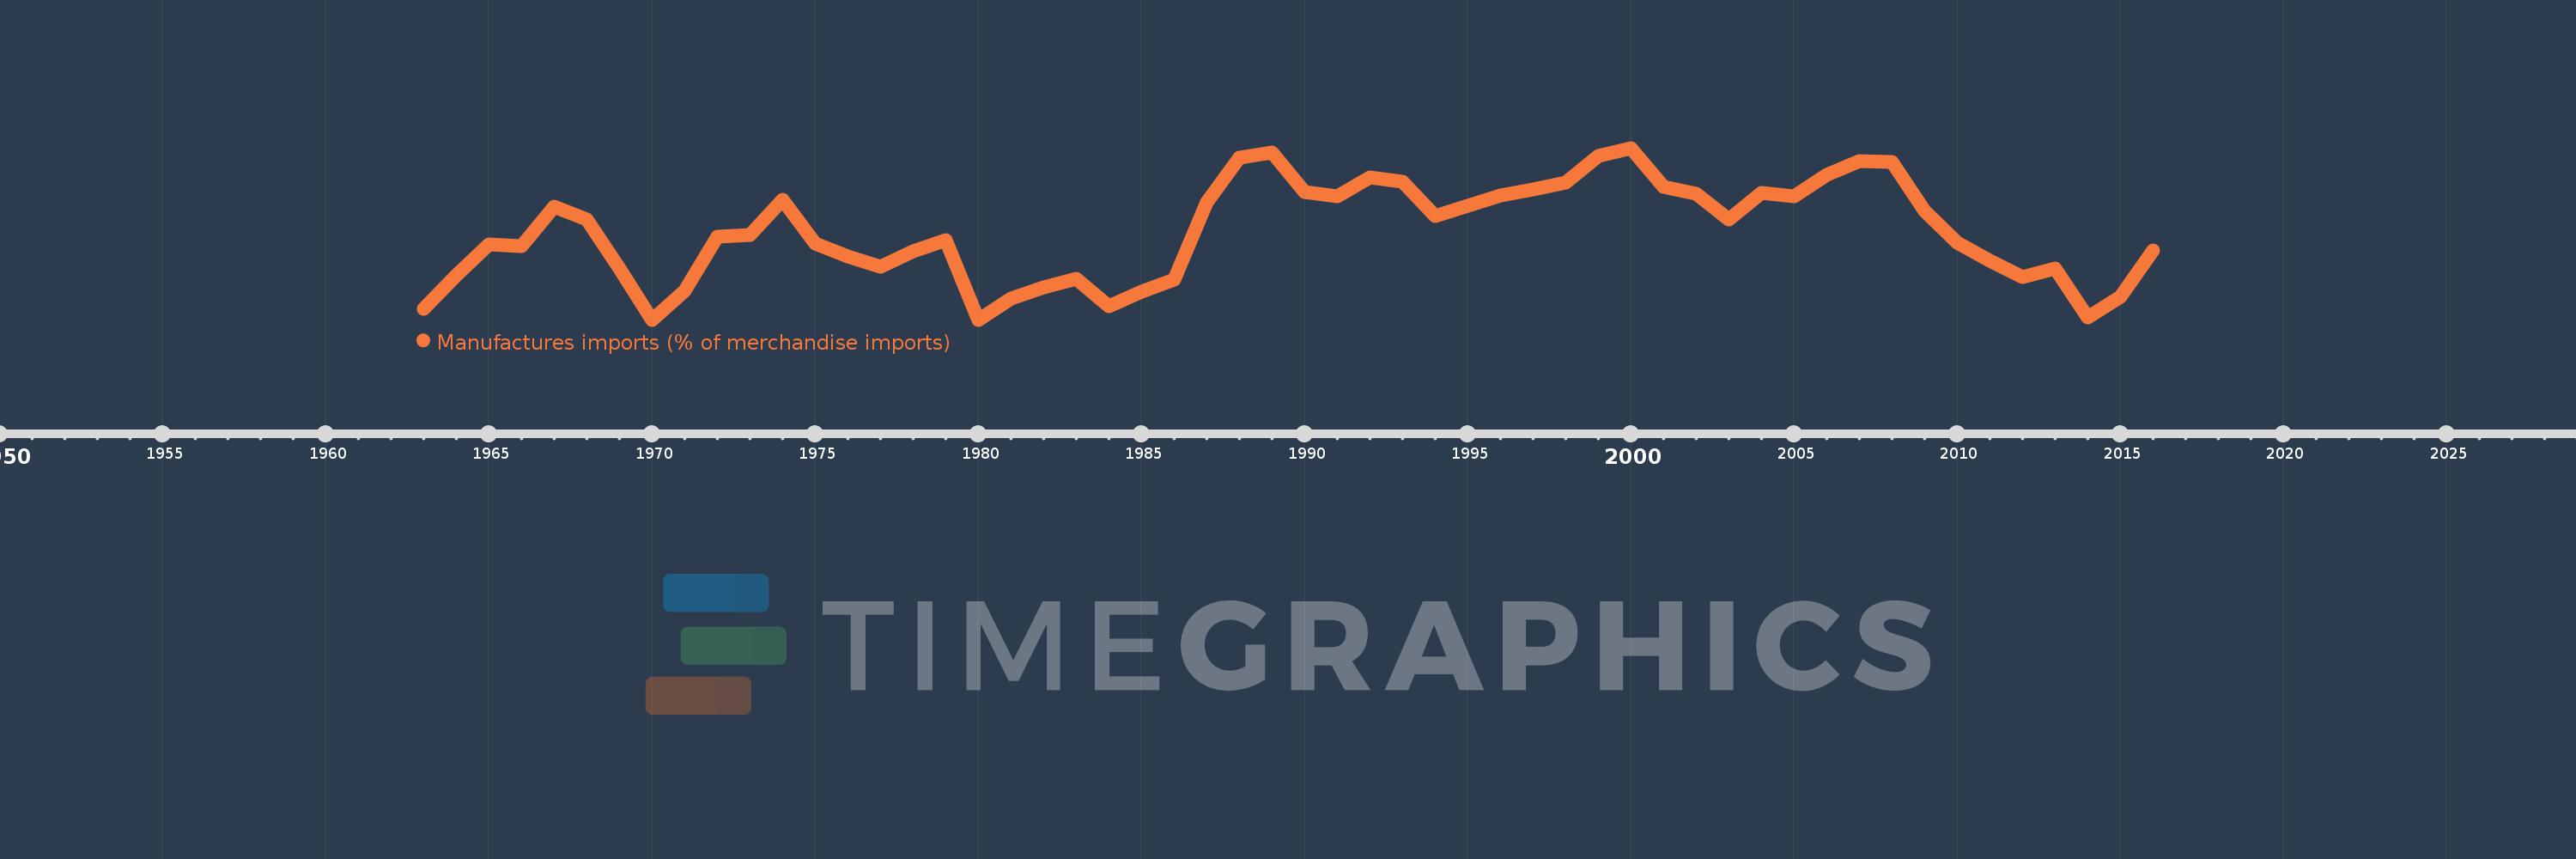
Manufactures imports (% of merchandise imports)
2016,2015,2014,2013,2012,2011,2010,2009,2008,2007,2006,2005,2004,2003,2002,2001,2000,1999,1998,1997,1996,1995,1994,1993,1992,1991,1990,1989,1988,1987,1986,1985,1984,1983,1982,1981,1980,1979,1978,1977,1976,1975,1974,1973,1972,1971,1970,1969,1968,1967,1966,1965,1964,1963
This statistics in other country:
AfghanistanAlbaniaAlgeriaAndorraAngolaAntigua and BarbudaArab WorldArgentinaArmeniaArubaAustraliaAustriaAzerbaijanBahamas, TheBahrainBangladeshBarbadosBelarusBelgiumBelizeBeninBermudaBhutanBoliviaBosnia and HerzegovinaBotswanaBrazilBrunei DarussalamBulgariaBurkina FasoBurundiCabo VerdeCambodiaCameroonCanadaCaribbean small statesCayman IslandsCentral African RepublicCentral Europe and the BalticsChadChileChinaColombiaComorosCongo, Dem. Rep.Congo, Rep.Costa RicaCote d'IvoireCroatiaCubaCyprusCzech RepublicDenmarkDjiboutiDominicaDominican RepublicEarly-demographic dividendEast Asia & PacificEast Asia & Pacific (excluding high income)East Asia & Pacific (IDA & IBRD countries)EcuadorEgypt, Arab Rep.El SalvadorEquatorial GuineaEritreaEstoniaEthiopiaEuro areaEurope & Central AsiaEurope & Central Asia (excluding high income)Europe & Central Asia (IDA & IBRD countries)European UnionFaroe IslandsFijiFinlandFragile and conflict affected situationsFranceFrench PolynesiaGabonGambia, TheGeorgiaGermanyGhanaGreeceGreenlandGrenadaGuatemalaGuineaGuinea-BissauGuyanaHaitiHeavily indebted poor countries (HIPC)High incomeHondurasHong Kong SAR, ChinaHungaryIBRD onlyIcelandIDA & IBRD totalIDA blendIDA onlyIDA totalIndiaIndonesiaIran, Islamic Rep.IraqIrelandIsraelItalyJamaicaJapanJordanKazakhstanKenyaKiribatiKorea, Rep.KuwaitKyrgyz RepublicLao PDRLate-demographic dividendLatin America & Caribbean Latin America & Caribbean (excluding high income)Latin America & the Caribbean (IDA & IBRD countries)LatviaLeast developed countries: UN classificationLebanonLesothoLiberiaLibyaLithuaniaLow & middle incomeLow incomeLower middle incomeLuxembourgMacao SAR, ChinaMacedonia, FYRMadagascarMalawiMalaysiaMaldivesMaliMaltaMauritaniaMauritiusMexicoMiddle East & North AfricaMiddle East & North Africa (excluding high income)Middle East & North Africa (IDA & IBRD countries)Middle incomeMoldovaMongoliaMoroccoMozambiqueMyanmarNamibiaNepalNetherlandsNew CaledoniaNew ZealandNicaraguaNigerNigeriaNorth AmericaNorwayOECD membersOmanOther small statesPacific island small statesPakistanPalauPanamaPapua New GuineaParaguayPeruPhilippinesPolandPortugalPost-demographic dividendPre-demographic dividendQatarRomaniaRussian FederationRwandaSamoaSao Tome and PrincipeSaudi ArabiaSenegalSerbiaSeychellesSierra LeoneSingaporeSlovak RepublicSloveniaSmall statesSolomon IslandsSomaliaSouth AfricaSouth AsiaSouth Asia (IDA & IBRD)SpainSri LankaSt. Kitts and NevisSt. LuciaSt. Vincent and the GrenadinesSub-Saharan Africa Sub-Saharan Africa (excluding high income)Sub-Saharan Africa (IDA & IBRD countries)SudanSurinameSwazilandSwedenSwitzerlandSyrian Arab RepublicTajikistanTanzaniaThailandTimor-LesteTogoTongaTrinidad and TobagoTunisiaTurkeyTurkmenistanTurks and Caicos IslandsTuvaluUgandaUkraineUnited Arab EmiratesUnited KingdomUnited StatesUpper middle incomeUruguayVanuatuVenezuela, RBVietnamVirgin Islands (U.S.)WorldYemen, Rep.ZambiaZimbabwe Timeline:
This timeline shows a graph from 1963 to 2016 of Iceland. No data until 1962. Number of actual observations by date: 54.
Source name:
World Development Indicators
Source organization:
World Bank staff estimates from the Comtrade database maintained by the United Nations Statistics Division.
Categories, topics:
Private Sector, Trade
Last updated:
apr 23, 2017
Indicators value changes by year
Minimum:
66.412
jan 1, 1980
Maximum:
81.927
jan 1, 2000
At the date of observation
Value
Absolute change
Change from previous value
jan 1, 1963
67.424
+67.424
0.0%
jan 1, 1964
70.454
+3.03
4.49%
jan 1, 1965
73.25
+2.796
3.97%
jan 1, 1966
73.068
-0.182
-0.25%
jan 1, 1967
76.617
+3.549
4.86%
jan 1, 1968
75.495
-1.123
-1.47%
jan 1, 1969
71.077
-4.418
-5.85%
jan 1, 1970
66.413
-4.664
-6.56%
jan 1, 1971
69.038
+2.625
3.95%
jan 1, 1972
73.948
+4.91
7.11%
jan 1, 1973
74.05
+0.102
0.14%
jan 1, 1974
77.261
+3.212
4.34%
jan 1, 1975
73.291
-3.971
-5.14%
jan 1, 1976
72.16
-1.131
-1.54%
jan 1, 1977
71.218
-0.942
-1.31%
jan 1, 1978
72.629
+1.411
1.98%
jan 1, 1979
73.64
+1.011
1.39%
jan 1, 1980
66.412
-7.229
-9.82%
jan 1, 1981
68.292
+1.88
2.83%
jan 1, 1982
69.324
+1.032
1.51%
jan 1, 1983
70.112
+0.788
1.14%
jan 1, 1984
67.65
-2.462
-3.51%
jan 1, 1985
68.921
+1.271
1.88%
jan 1, 1986
70.03
+1.108
1.61%
jan 1, 1987
77.011
+6.982
9.97%
jan 1, 1988
81.068
+4.056
5.27%
jan 1, 1989
81.534
+0.466
0.58%
jan 1, 1990
77.912
-3.622
-4.44%
jan 1, 1991
77.552
-0.359
-0.46%
jan 1, 1992
79.297
+1.745
2.25%
jan 1, 1993
78.907
-0.391
-0.49%
jan 1, 1994
75.758
-3.149
-3.99%
jan 1, 1995
76.685
+0.927
1.22%
jan 1, 1996
77.604
+0.919
1.2%
jan 1, 1997
78.149
+0.545
0.7%
jan 1, 1998
78.798
+0.649
0.83%
jan 1, 1999
81.238
+2.44
3.1%
jan 1, 2000
81.927
+0.689
0.85%
jan 1, 2001
78.424
-3.504
-4.28%
jan 1, 2002
77.763
-0.661
-0.84%
jan 1, 2003
75.458
-2.305
-2.96%
jan 1, 2004
77.862
+2.404
3.19%
jan 1, 2005
77.555
-0.307
-0.39%
jan 1, 2006
79.492
+1.937
2.5%
jan 1, 2007
80.769
+1.277
1.61%
jan 1, 2008
80.635
-0.134
-0.17%
jan 1, 2009
76.233
-4.402
-5.46%
jan 1, 2010
73.409
-2.824
-3.7%
jan 1, 2011
71.746
-1.664
-2.27%
jan 1, 2012
70.289
-1.457
-2.03%
jan 1, 2013
71.052
+0.763
1.09%
jan 1, 2014
66.626
-4.426
-6.23%
jan 1, 2015
68.503
+1.877
2.82%
jan 1, 2016
72.684
+4.181
6.1%
Ranking of countries by current statistics by years


Comments: