29
/
en
AIzaSyAYiBZKx7MnpbEhh9jyipgxe19OcubqV5w
April 1, 2024
170180
Korea, Rep.
KOR
true
2
1
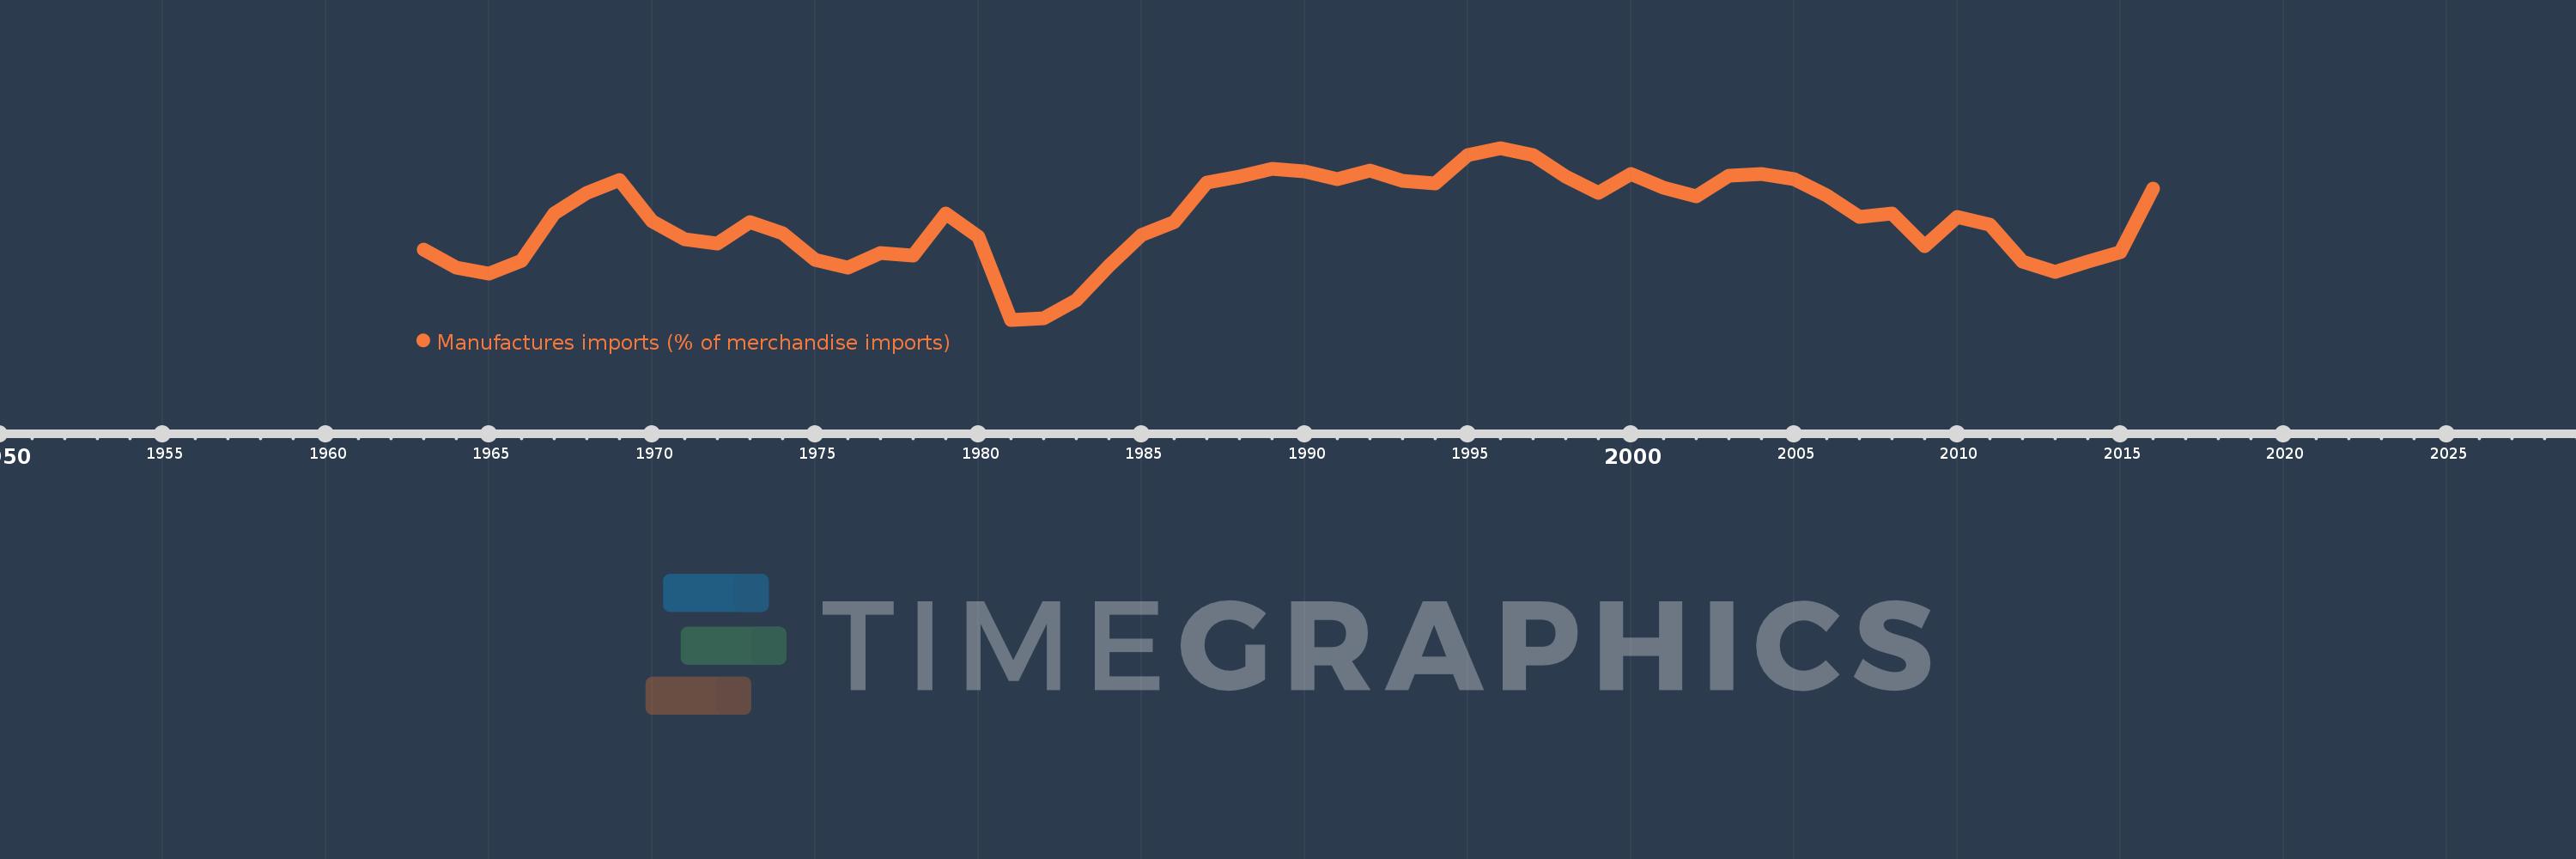
Manufactures imports (% of merchandise imports)
2016,2015,2014,2013,2012,2011,2010,2009,2008,2007,2006,2005,2004,2003,2002,2001,2000,1999,1998,1997,1996,1995,1994,1993,1992,1991,1990,1989,1988,1987,1986,1985,1984,1983,1982,1981,1980,1979,1978,1977,1976,1975,1974,1973,1972,1971,1970,1969,1968,1967,1966,1965,1964,1963
This statistics in other country:
AfghanistanAlbaniaAlgeriaAndorraAngolaAntigua and BarbudaArab WorldArgentinaArmeniaArubaAustraliaAustriaAzerbaijanBahamas, TheBahrainBangladeshBarbadosBelarusBelgiumBelizeBeninBermudaBhutanBoliviaBosnia and HerzegovinaBotswanaBrazilBrunei DarussalamBulgariaBurkina FasoBurundiCabo VerdeCambodiaCameroonCanadaCaribbean small statesCayman IslandsCentral African RepublicCentral Europe and the BalticsChadChileChinaColombiaComorosCongo, Dem. Rep.Congo, Rep.Costa RicaCote d'IvoireCroatiaCubaCyprusCzech RepublicDenmarkDjiboutiDominicaDominican RepublicEarly-demographic dividendEast Asia & PacificEast Asia & Pacific (excluding high income)East Asia & Pacific (IDA & IBRD countries)EcuadorEgypt, Arab Rep.El SalvadorEquatorial GuineaEritreaEstoniaEthiopiaEuro areaEurope & Central AsiaEurope & Central Asia (excluding high income)Europe & Central Asia (IDA & IBRD countries)European UnionFaroe IslandsFijiFinlandFragile and conflict affected situationsFranceFrench PolynesiaGabonGambia, TheGeorgiaGermanyGhanaGreeceGreenlandGrenadaGuatemalaGuineaGuinea-BissauGuyanaHaitiHeavily indebted poor countries (HIPC)High incomeHondurasHong Kong SAR, ChinaHungaryIBRD onlyIcelandIDA & IBRD totalIDA blendIDA onlyIDA totalIndiaIndonesiaIran, Islamic Rep.IraqIrelandIsraelItalyJamaicaJapanJordanKazakhstanKenyaKiribatiKorea, Rep.KuwaitKyrgyz RepublicLao PDRLate-demographic dividendLatin America & Caribbean Latin America & Caribbean (excluding high income)Latin America & the Caribbean (IDA & IBRD countries)LatviaLeast developed countries: UN classificationLebanonLesothoLiberiaLibyaLithuaniaLow & middle incomeLow incomeLower middle incomeLuxembourgMacao SAR, ChinaMacedonia, FYRMadagascarMalawiMalaysiaMaldivesMaliMaltaMauritaniaMauritiusMexicoMiddle East & North AfricaMiddle East & North Africa (excluding high income)Middle East & North Africa (IDA & IBRD countries)Middle incomeMoldovaMongoliaMoroccoMozambiqueMyanmarNamibiaNepalNetherlandsNew CaledoniaNew ZealandNicaraguaNigerNigeriaNorth AmericaNorwayOECD membersOmanOther small statesPacific island small statesPakistanPalauPanamaPapua New GuineaParaguayPeruPhilippinesPolandPortugalPost-demographic dividendPre-demographic dividendQatarRomaniaRussian FederationRwandaSamoaSao Tome and PrincipeSaudi ArabiaSenegalSerbiaSeychellesSierra LeoneSingaporeSlovak RepublicSloveniaSmall statesSolomon IslandsSomaliaSouth AfricaSouth AsiaSouth Asia (IDA & IBRD)SpainSri LankaSt. Kitts and NevisSt. LuciaSt. Vincent and the GrenadinesSub-Saharan Africa Sub-Saharan Africa (excluding high income)Sub-Saharan Africa (IDA & IBRD countries)SudanSurinameSwazilandSwedenSwitzerlandSyrian Arab RepublicTajikistanTanzaniaThailandTimor-LesteTogoTongaTrinidad and TobagoTunisiaTurkeyTurkmenistanTurks and Caicos IslandsTuvaluUgandaUkraineUnited Arab EmiratesUnited KingdomUnited StatesUpper middle incomeUruguayVanuatuVenezuela, RBVietnamVirgin Islands (U.S.)WorldYemen, Rep.ZambiaZimbabwe Timeline:
This timeline shows a graph from 1963 to 2016 of Korea, Rep.. No data until 1962. Number of actual observations by date: 54.
Source name:
World Development Indicators
Source organization:
World Bank staff estimates from the Comtrade database maintained by the United Nations Statistics Division.
Categories, topics:
Private Sector, Trade
Last updated:
apr 23, 2017
Indicators value changes by year
Minimum:
43.093
jan 1, 1981
Maximum:
67.951
jan 1, 1996
At the date of observation
Value
Absolute change
Change from previous value
jan 1, 1963
53.295
+53.295
0.0%
jan 1, 1964
50.59
-2.705
-5.08%
jan 1, 1965
49.741
-0.849
-1.68%
jan 1, 1966
51.578
+1.837
3.69%
jan 1, 1967
58.482
+6.904
13.39%
jan 1, 1968
61.413
+2.931
5.01%
jan 1, 1969
63.256
+1.842
3.0%
jan 1, 1970
57.339
-5.917
-9.35%
jan 1, 1971
54.764
-2.575
-4.49%
jan 1, 1972
54.17
-0.595
-1.09%
jan 1, 1973
57.215
+3.046
5.62%
jan 1, 1974
55.608
-1.607
-2.81%
jan 1, 1975
51.725
-3.882
-6.98%
jan 1, 1976
50.671
-1.054
-2.04%
jan 1, 1977
52.735
+2.063
4.07%
jan 1, 1978
52.368
-0.367
-0.7%
jan 1, 1979
58.526
+6.158
11.76%
jan 1, 1980
55.151
-3.375
-5.77%
jan 1, 1981
43.093
-12.058
-21.86%
jan 1, 1982
43.261
+0.168
0.39%
jan 1, 1983
45.887
+2.627
6.07%
jan 1, 1984
50.872
+4.985
10.86%
jan 1, 1985
55.318
+4.447
8.74%
jan 1, 1986
57.187
+1.868
3.38%
jan 1, 1987
62.976
+5.789
10.12%
jan 1, 1988
63.81
+0.835
1.33%
jan 1, 1989
64.972
+1.162
1.82%
jan 1, 1990
64.525
-0.447
-0.69%
jan 1, 1991
63.411
-1.114
-1.73%
jan 1, 1992
64.739
+1.328
2.09%
jan 1, 1993
63.246
-1.493
-2.31%
jan 1, 1994
62.878
-0.368
-0.58%
jan 1, 1995
66.868
+3.99
6.35%
jan 1, 1996
67.951
+1.082
1.62%
jan 1, 1997
66.919
-1.031
-1.52%
jan 1, 1998
63.848
-3.071
-4.59%
jan 1, 1999
61.412
-2.436
-3.82%
jan 1, 2000
64.139
+2.727
4.44%
jan 1, 2001
62.177
-1.963
-3.06%
jan 1, 2002
60.895
-1.282
-2.06%
jan 1, 2003
63.949
+3.054
5.02%
jan 1, 2004
64.217
+0.268
0.42%
jan 1, 2005
63.406
-0.811
-1.26%
jan 1, 2006
61.081
-2.325
-3.67%
jan 1, 2007
57.987
-3.094
-5.07%
jan 1, 2008
58.476
+0.489
0.84%
jan 1, 2009
53.719
-4.757
-8.14%
jan 1, 2010
58.019
+4.3
8.01%
jan 1, 2011
56.837
-1.182
-2.04%
jan 1, 2012
51.45
-5.387
-9.48%
jan 1, 2013
49.968
-1.482
-2.88%
jan 1, 2014
51.55
+1.582
3.17%
jan 1, 2015
52.916
+1.366
2.65%
jan 1, 2016
62.06
+9.144
17.28%
Ranking of countries by current statistics by years


Comments: