29
/
en
AIzaSyAYiBZKx7MnpbEhh9jyipgxe19OcubqV5w
April 1, 2024
245860
South Africa
ZAF
true
2
1
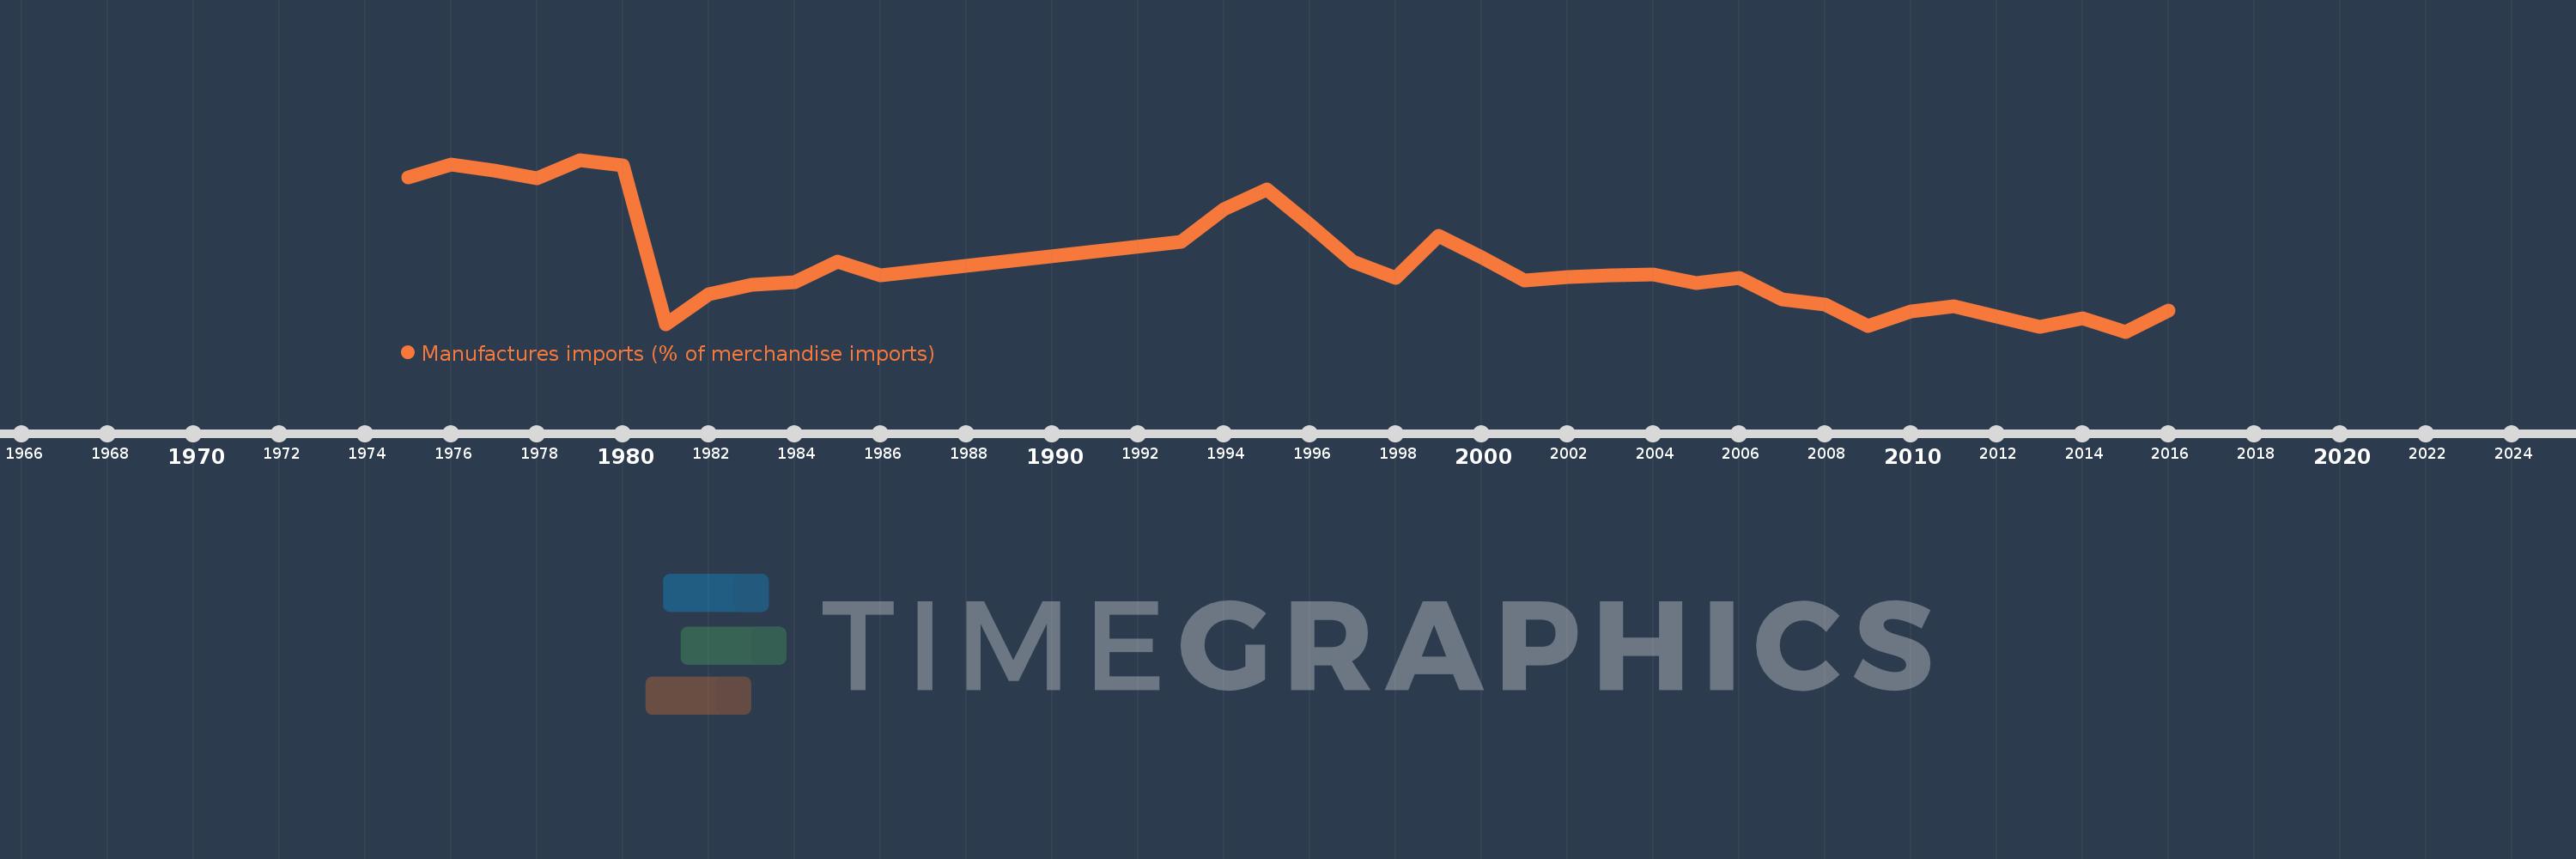
Manufactures imports (% of merchandise imports)
2016,2015,2014,2013,2012,2011,2010,2009,2008,2007,2006,2005,2004,2003,2002,2001,2000,1999,1998,1997,1996,1995,1994,1993,1986,1985,1984,1983,1982,1981,1980,1979,1978,1977,1976,1975
This statistics in other country:
AfghanistanAlbaniaAlgeriaAndorraAngolaAntigua and BarbudaArab WorldArgentinaArmeniaArubaAustraliaAustriaAzerbaijanBahamas, TheBahrainBangladeshBarbadosBelarusBelgiumBelizeBeninBermudaBhutanBoliviaBosnia and HerzegovinaBotswanaBrazilBrunei DarussalamBulgariaBurkina FasoBurundiCabo VerdeCambodiaCameroonCanadaCaribbean small statesCayman IslandsCentral African RepublicCentral Europe and the BalticsChadChileChinaColombiaComorosCongo, Dem. Rep.Congo, Rep.Costa RicaCote d'IvoireCroatiaCubaCyprusCzech RepublicDenmarkDjiboutiDominicaDominican RepublicEarly-demographic dividendEast Asia & PacificEast Asia & Pacific (excluding high income)East Asia & Pacific (IDA & IBRD countries)EcuadorEgypt, Arab Rep.El SalvadorEquatorial GuineaEritreaEstoniaEthiopiaEuro areaEurope & Central AsiaEurope & Central Asia (excluding high income)Europe & Central Asia (IDA & IBRD countries)European UnionFaroe IslandsFijiFinlandFragile and conflict affected situationsFranceFrench PolynesiaGabonGambia, TheGeorgiaGermanyGhanaGreeceGreenlandGrenadaGuatemalaGuineaGuinea-BissauGuyanaHaitiHeavily indebted poor countries (HIPC)High incomeHondurasHong Kong SAR, ChinaHungaryIBRD onlyIcelandIDA & IBRD totalIDA blendIDA onlyIDA totalIndiaIndonesiaIran, Islamic Rep.IraqIrelandIsraelItalyJamaicaJapanJordanKazakhstanKenyaKiribatiKorea, Rep.KuwaitKyrgyz RepublicLao PDRLate-demographic dividendLatin America & Caribbean Latin America & Caribbean (excluding high income)Latin America & the Caribbean (IDA & IBRD countries)LatviaLeast developed countries: UN classificationLebanonLesothoLiberiaLibyaLithuaniaLow & middle incomeLow incomeLower middle incomeLuxembourgMacao SAR, ChinaMacedonia, FYRMadagascarMalawiMalaysiaMaldivesMaliMaltaMauritaniaMauritiusMexicoMiddle East & North AfricaMiddle East & North Africa (excluding high income)Middle East & North Africa (IDA & IBRD countries)Middle incomeMoldovaMongoliaMoroccoMozambiqueMyanmarNamibiaNepalNetherlandsNew CaledoniaNew ZealandNicaraguaNigerNigeriaNorth AmericaNorwayOECD membersOmanOther small statesPacific island small statesPakistanPalauPanamaPapua New GuineaParaguayPeruPhilippinesPolandPortugalPost-demographic dividendPre-demographic dividendQatarRomaniaRussian FederationRwandaSamoaSao Tome and PrincipeSaudi ArabiaSenegalSerbiaSeychellesSierra LeoneSingaporeSlovak RepublicSloveniaSmall statesSolomon IslandsSomaliaSouth AfricaSouth AsiaSouth Asia (IDA & IBRD)SpainSri LankaSt. Kitts and NevisSt. LuciaSt. Vincent and the GrenadinesSub-Saharan Africa Sub-Saharan Africa (excluding high income)Sub-Saharan Africa (IDA & IBRD countries)SudanSurinameSwazilandSwedenSwitzerlandSyrian Arab RepublicTajikistanTanzaniaThailandTimor-LesteTogoTongaTrinidad and TobagoTunisiaTurkeyTurkmenistanTurks and Caicos IslandsTuvaluUgandaUkraineUnited Arab EmiratesUnited KingdomUnited StatesUpper middle incomeUruguayVanuatuVenezuela, RBVietnamVirgin Islands (U.S.)WorldYemen, Rep.ZambiaZimbabwe Timeline:
This timeline shows a graph from 1975 to 2016 of South Africa. No data until 1974. Number of actual observations by date: 36.
Source name:
World Development Indicators
Source organization:
World Bank staff estimates from the Comtrade database maintained by the United Nations Statistics Division.
Categories, topics:
Private Sector, Trade
Last updated:
apr 23, 2017
Indicators value changes by year
Minimum:
61.082
jan 1, 2015
At the date of observation
Value
Absolute change
Change from previous value
jan 1, 1975
85.649
+85.649
0.0%
jan 1, 1976
87.799
+2.151
2.51%
jan 1, 1977
86.8
-0.999
-1.14%
jan 1, 1978
85.539
-1.261
-1.45%
jan 1, 1979
88.53
+2.991
3.5%
jan 1, 1980
87.662
-0.869
-0.98%
jan 1, 1981
62.187
-25.474
-29.06%
jan 1, 1982
67.038
+4.851
7.8%
jan 1, 1983
68.531
+1.493
2.23%
jan 1, 1984
69.003
+0.472
0.69%
jan 1, 1985
72.234
+3.23
4.68%
jan 1, 1986
70.006
-2.228
-3.08%
jan 1, 1993
75.37
+5.364
7.66%
jan 1, 1994
80.7
+5.33
7.07%
jan 1, 1995
83.803
+3.103
3.85%
jan 1, 1996
78.173
-5.63
-6.72%
jan 1, 1997
72.304
-5.869
-7.51%
jan 1, 1998
69.639
-2.666
-3.69%
jan 1, 1999
76.346
+6.707
9.63%
jan 1, 2000
72.999
-3.346
-4.38%
jan 1, 2001
69.3
-3.7
-5.07%
jan 1, 2002
69.863
+0.563
0.81%
jan 1, 2003
70.105
+0.242
0.35%
jan 1, 2004
70.207
+0.102
0.15%
jan 1, 2005
68.81
-1.397
-1.99%
jan 1, 2006
69.602
+0.792
1.15%
jan 1, 2007
66.16
-3.442
-4.95%
jan 1, 2008
65.466
-0.694
-1.05%
jan 1, 2009
61.968
-3.498
-5.34%
jan 1, 2010
64.308
+2.34
3.78%
jan 1, 2011
65.105
+0.798
1.24%
jan 1, 2012
63.453
-1.652
-2.54%
jan 1, 2013
61.849
-1.604
-2.53%
jan 1, 2014
63.262
+1.414
2.29%
jan 1, 2015
61.082
-2.18
-3.45%
jan 1, 2016
64.491
+3.408
5.58%
Ranking of countries by current statistics by years


Comments: