29
/
en
AIzaSyAYiBZKx7MnpbEhh9jyipgxe19OcubqV5w
April 1, 2024
142048
Greece
GRC
true
2
1
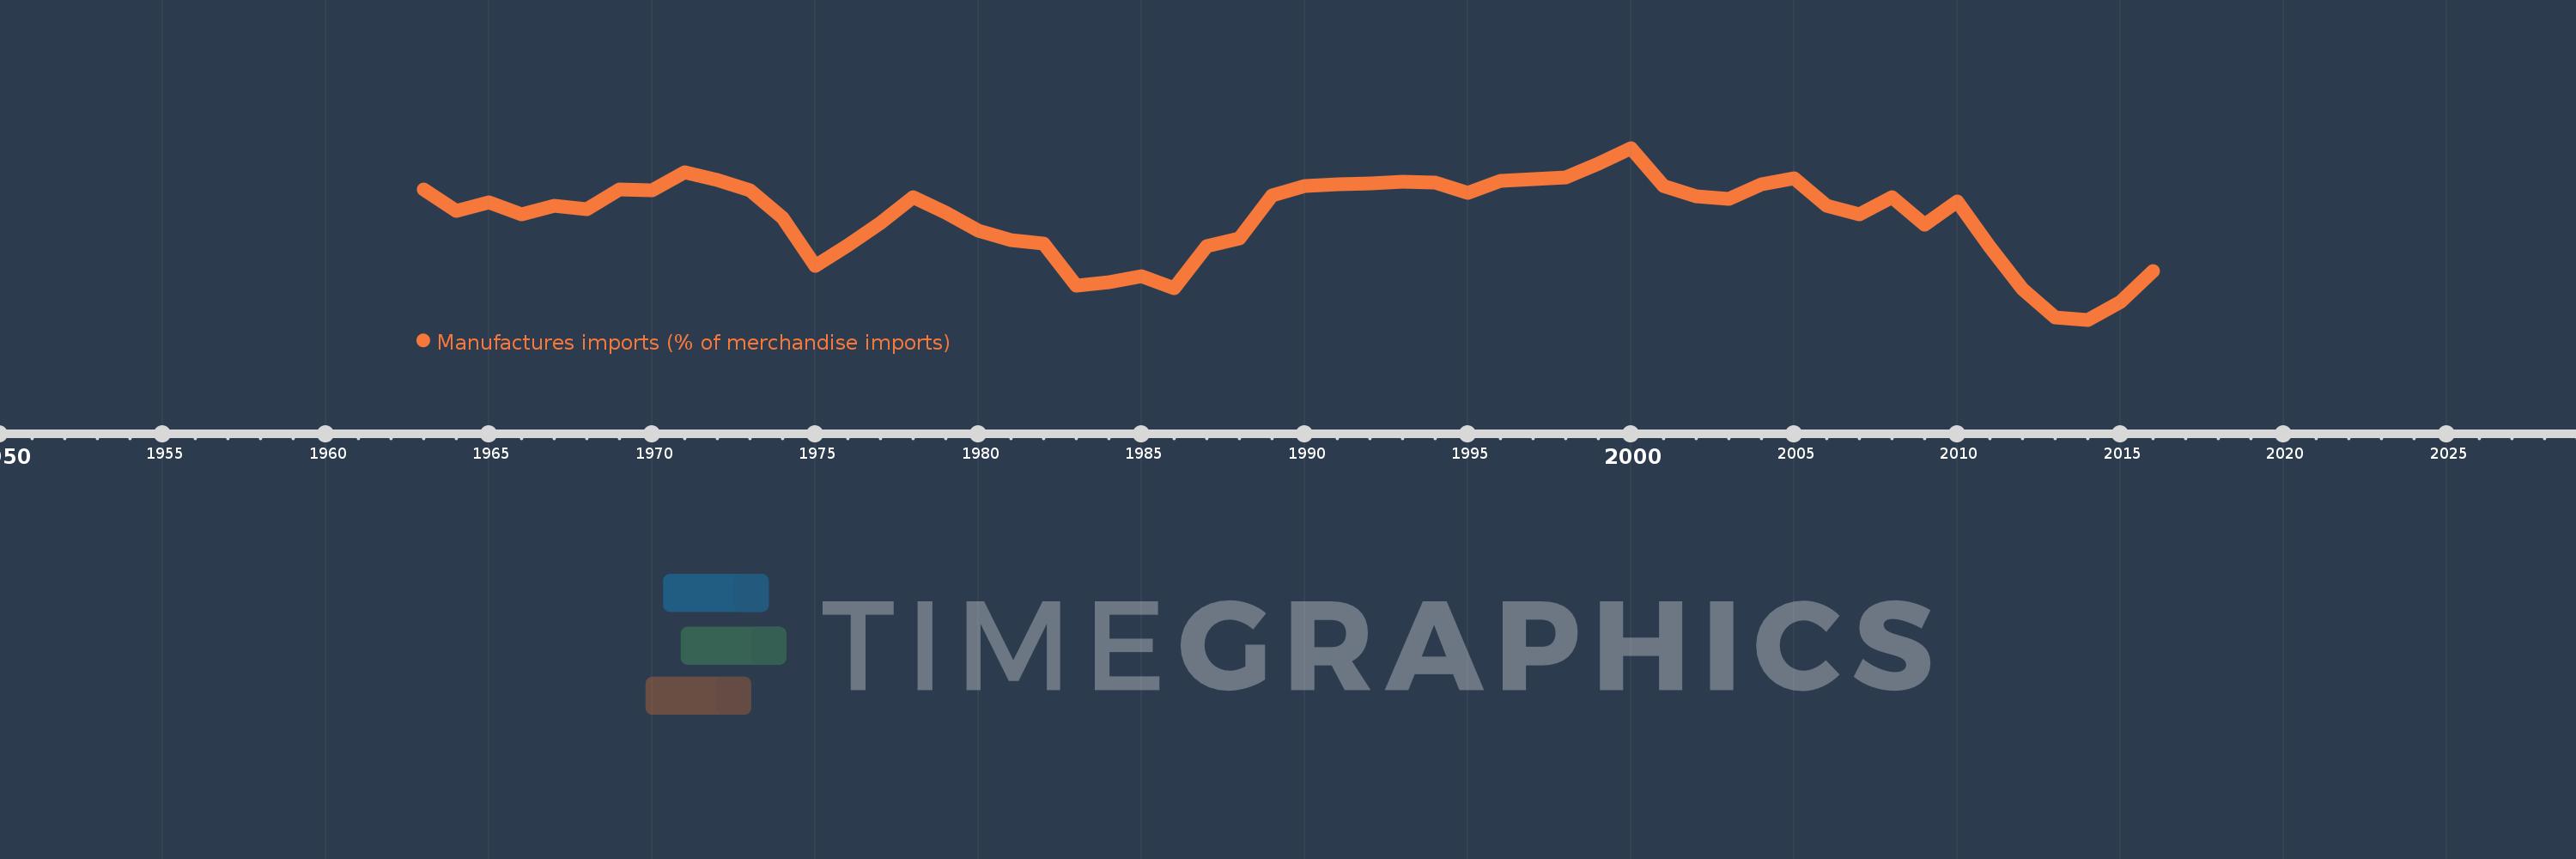
Manufactures imports (% of merchandise imports)
2016,2015,2014,2013,2012,2011,2010,2009,2008,2007,2006,2005,2004,2003,2002,2001,2000,1999,1998,1997,1996,1995,1994,1993,1992,1991,1990,1989,1988,1987,1986,1985,1984,1983,1982,1981,1980,1979,1978,1977,1976,1975,1974,1973,1972,1971,1970,1969,1968,1967,1966,1965,1964,1963
This statistics in other country:
AfghanistanAlbaniaAlgeriaAndorraAngolaAntigua and BarbudaArab WorldArgentinaArmeniaArubaAustraliaAustriaAzerbaijanBahamas, TheBahrainBangladeshBarbadosBelarusBelgiumBelizeBeninBermudaBhutanBoliviaBosnia and HerzegovinaBotswanaBrazilBrunei DarussalamBulgariaBurkina FasoBurundiCabo VerdeCambodiaCameroonCanadaCaribbean small statesCayman IslandsCentral African RepublicCentral Europe and the BalticsChadChileChinaColombiaComorosCongo, Dem. Rep.Congo, Rep.Costa RicaCote d'IvoireCroatiaCubaCyprusCzech RepublicDenmarkDjiboutiDominicaDominican RepublicEarly-demographic dividendEast Asia & PacificEast Asia & Pacific (excluding high income)East Asia & Pacific (IDA & IBRD countries)EcuadorEgypt, Arab Rep.El SalvadorEquatorial GuineaEritreaEstoniaEthiopiaEuro areaEurope & Central AsiaEurope & Central Asia (excluding high income)Europe & Central Asia (IDA & IBRD countries)European UnionFaroe IslandsFijiFinlandFragile and conflict affected situationsFranceFrench PolynesiaGabonGambia, TheGeorgiaGermanyGhanaGreeceGreenlandGrenadaGuatemalaGuineaGuinea-BissauGuyanaHaitiHeavily indebted poor countries (HIPC)High incomeHondurasHong Kong SAR, ChinaHungaryIBRD onlyIcelandIDA & IBRD totalIDA blendIDA onlyIDA totalIndiaIndonesiaIran, Islamic Rep.IraqIrelandIsraelItalyJamaicaJapanJordanKazakhstanKenyaKiribatiKorea, Rep.KuwaitKyrgyz RepublicLao PDRLate-demographic dividendLatin America & Caribbean Latin America & Caribbean (excluding high income)Latin America & the Caribbean (IDA & IBRD countries)LatviaLeast developed countries: UN classificationLebanonLesothoLiberiaLibyaLithuaniaLow & middle incomeLow incomeLower middle incomeLuxembourgMacao SAR, ChinaMacedonia, FYRMadagascarMalawiMalaysiaMaldivesMaliMaltaMauritaniaMauritiusMexicoMiddle East & North AfricaMiddle East & North Africa (excluding high income)Middle East & North Africa (IDA & IBRD countries)Middle incomeMoldovaMongoliaMoroccoMozambiqueMyanmarNamibiaNepalNetherlandsNew CaledoniaNew ZealandNicaraguaNigerNigeriaNorth AmericaNorwayOECD membersOmanOther small statesPacific island small statesPakistanPalauPanamaPapua New GuineaParaguayPeruPhilippinesPolandPortugalPost-demographic dividendPre-demographic dividendQatarRomaniaRussian FederationRwandaSamoaSao Tome and PrincipeSaudi ArabiaSenegalSerbiaSeychellesSierra LeoneSingaporeSlovak RepublicSloveniaSmall statesSolomon IslandsSomaliaSouth AfricaSouth AsiaSouth Asia (IDA & IBRD)SpainSri LankaSt. Kitts and NevisSt. LuciaSt. Vincent and the GrenadinesSub-Saharan Africa Sub-Saharan Africa (excluding high income)Sub-Saharan Africa (IDA & IBRD countries)SudanSurinameSwazilandSwedenSwitzerlandSyrian Arab RepublicTajikistanTanzaniaThailandTimor-LesteTogoTongaTrinidad and TobagoTunisiaTurkeyTurkmenistanTurks and Caicos IslandsTuvaluUgandaUkraineUnited Arab EmiratesUnited KingdomUnited StatesUpper middle incomeUruguayVanuatuVenezuela, RBVietnamVirgin Islands (U.S.)WorldYemen, Rep.ZambiaZimbabwe Timeline:
This timeline shows a graph from 1963 to 2016 of Greece. No data until 1962. Number of actual observations by date: 54.
Source name:
World Development Indicators
Source organization:
World Bank staff estimates from the Comtrade database maintained by the United Nations Statistics Division.
Categories, topics:
Private Sector, Trade
Last updated:
apr 23, 2017
Indicators value changes by year
Minimum:
45.365
jan 1, 2014
Maximum:
77.264
jan 1, 2000
At the date of observation
Value
Absolute change
Change from previous value
jan 1, 1963
69.584
+69.584
0.0%
jan 1, 1964
65.646
-3.938
-5.66%
jan 1, 1965
67.13
+1.484
2.26%
jan 1, 1966
64.868
-2.263
-3.37%
jan 1, 1967
66.506
+1.638
2.53%
jan 1, 1968
65.906
-0.6
-0.9%
jan 1, 1969
69.572
+3.666
5.56%
jan 1, 1970
69.372
-0.199
-0.29%
jan 1, 1971
72.726
+3.354
4.83%
jan 1, 1972
71.291
-1.435
-1.97%
jan 1, 1973
69.402
-1.889
-2.65%
jan 1, 1974
64.285
-5.117
-7.37%
jan 1, 1975
55.388
-8.897
-13.84%
jan 1, 1976
59.194
+3.806
6.87%
jan 1, 1977
63.305
+4.111
6.95%
jan 1, 1978
68.166
+4.861
7.68%
jan 1, 1979
65.214
-2.952
-4.33%
jan 1, 1980
61.827
-3.387
-5.19%
jan 1, 1981
60.154
-1.674
-2.71%
jan 1, 1982
59.434
-0.719
-1.2%
jan 1, 1983
51.697
-7.737
-13.02%
jan 1, 1984
52.405
+0.708
1.37%
jan 1, 1985
53.432
+1.027
1.96%
jan 1, 1986
51.19
-2.242
-4.2%
jan 1, 1987
59.085
+7.894
15.42%
jan 1, 1988
60.525
+1.44
2.44%
jan 1, 1989
68.521
+7.996
13.21%
jan 1, 1990
70.189
+1.668
2.43%
jan 1, 1991
70.46
+0.271
0.39%
jan 1, 1992
70.674
+0.214
0.3%
jan 1, 1993
71.052
+0.378
0.53%
jan 1, 1994
70.872
-0.179
-0.25%
jan 1, 1995
68.868
-2.005
-2.83%
jan 1, 1996
71.12
+2.252
3.27%
jan 1, 1997
71.463
+0.343
0.48%
jan 1, 1998
71.863
+0.4
0.56%
jan 1, 1999
74.291
+2.429
3.38%
jan 1, 2000
77.264
+2.972
4.0%
jan 1, 2001
70.146
-7.117
-9.21%
jan 1, 2002
68.283
-1.864
-2.66%
jan 1, 2003
67.777
-0.506
-0.74%
jan 1, 2004
70.551
+2.774
4.09%
jan 1, 2005
71.694
+1.143
1.62%
jan 1, 2006
66.468
-5.226
-7.29%
jan 1, 2007
64.935
-1.534
-2.31%
jan 1, 2008
68.128
+3.193
4.92%
jan 1, 2009
63.098
-5.03
-7.38%
jan 1, 2010
67.386
+4.288
6.8%
jan 1, 2011
58.842
-8.544
-12.68%
jan 1, 2012
51.039
-7.803
-13.26%
jan 1, 2013
45.779
-5.259
-10.3%
jan 1, 2014
45.365
-0.414
-0.9%
jan 1, 2015
48.595
+3.23
7.12%
jan 1, 2016
54.402
+5.808
11.95%
Ranking of countries by current statistics by years


Comments: