29
/
en
AIzaSyAYiBZKx7MnpbEhh9jyipgxe19OcubqV5w
April 1, 2024
248987
Sri Lanka
LKA
true
2
1
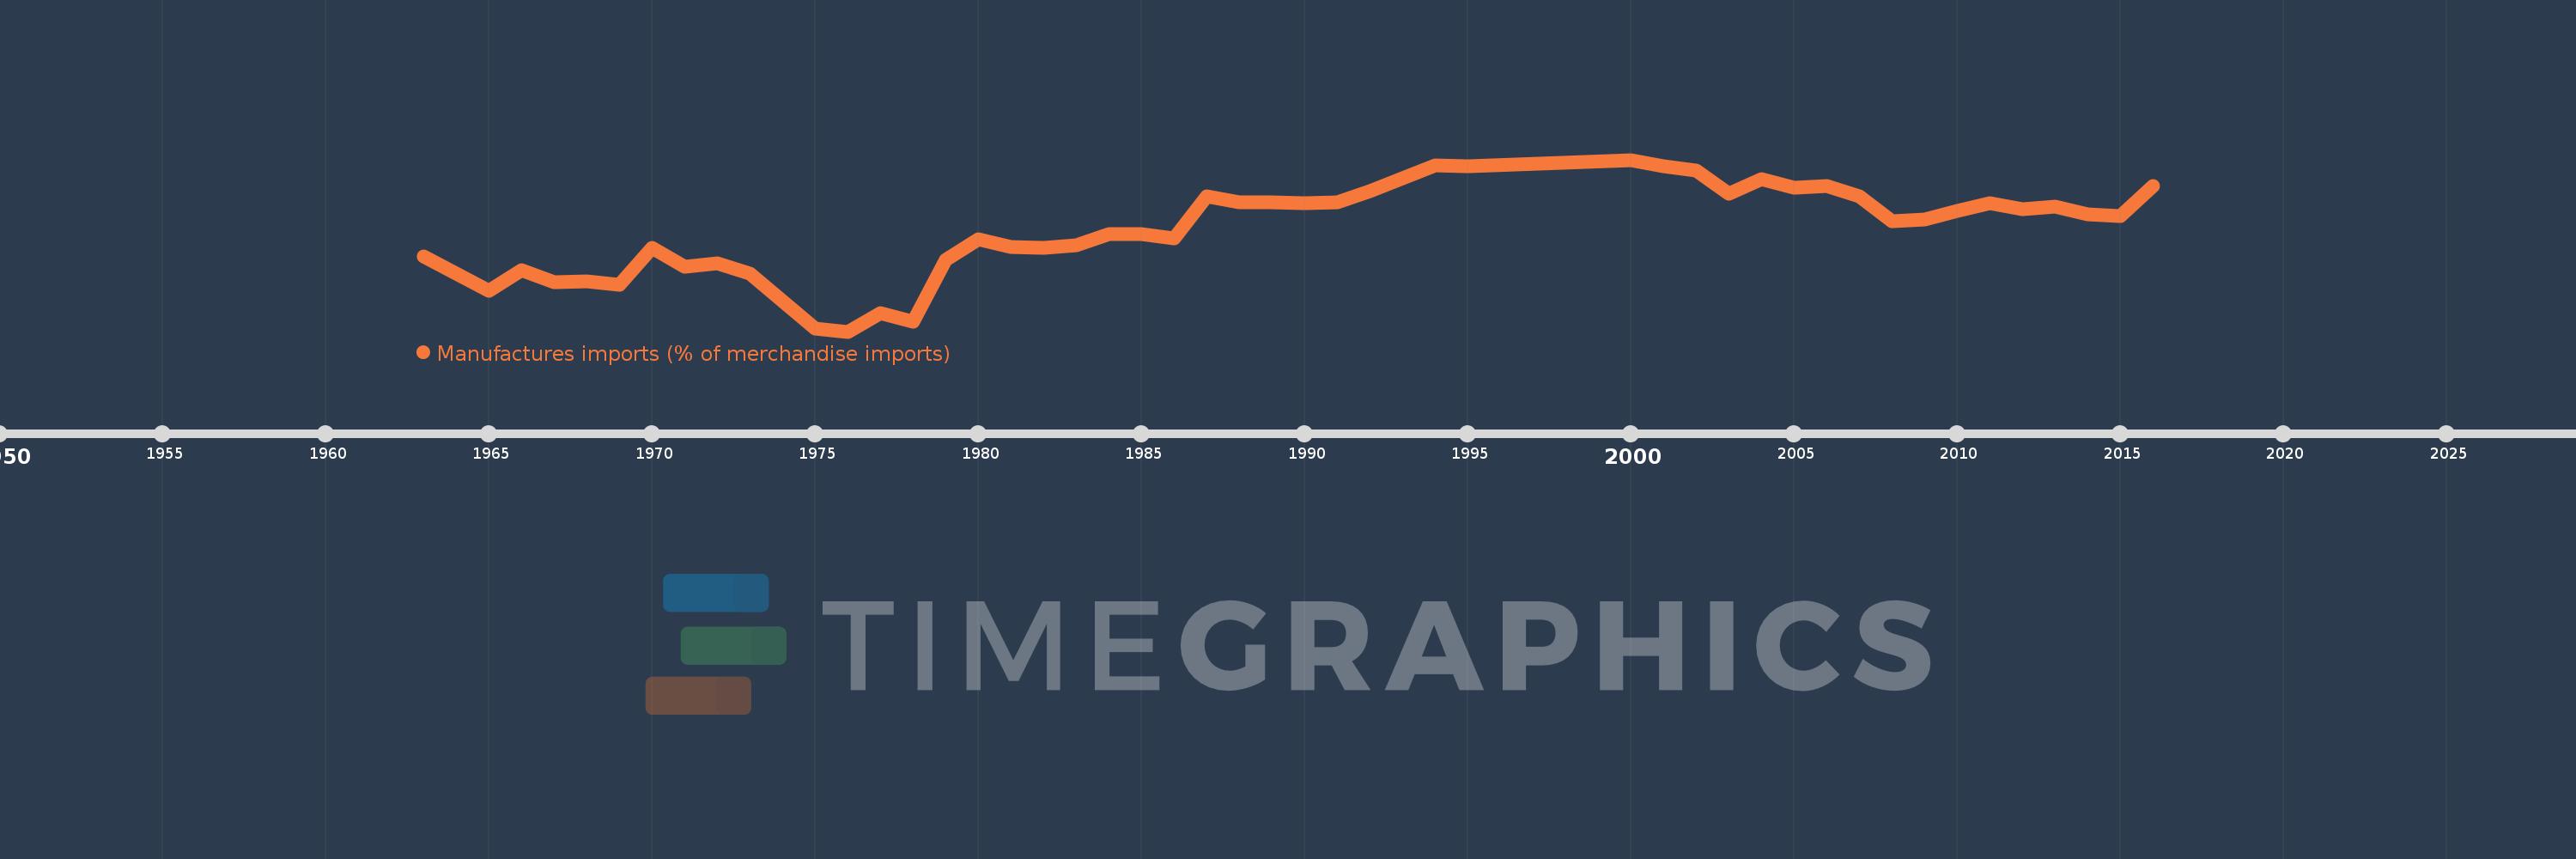
Manufactures imports (% of merchandise imports)
2016,2015,2014,2013,2012,2011,2010,2009,2008,2007,2006,2005,2004,2003,2002,2001,2000,1995,1994,1993,1992,1991,1990,1989,1988,1987,1986,1985,1984,1983,1982,1981,1980,1979,1978,1977,1976,1975,1973,1972,1971,1970,1969,1968,1967,1966,1965,1964,1963
This statistics in other country:
AfghanistanAlbaniaAlgeriaAndorraAngolaAntigua and BarbudaArab WorldArgentinaArmeniaArubaAustraliaAustriaAzerbaijanBahamas, TheBahrainBangladeshBarbadosBelarusBelgiumBelizeBeninBermudaBhutanBoliviaBosnia and HerzegovinaBotswanaBrazilBrunei DarussalamBulgariaBurkina FasoBurundiCabo VerdeCambodiaCameroonCanadaCaribbean small statesCayman IslandsCentral African RepublicCentral Europe and the BalticsChadChileChinaColombiaComorosCongo, Dem. Rep.Congo, Rep.Costa RicaCote d'IvoireCroatiaCubaCyprusCzech RepublicDenmarkDjiboutiDominicaDominican RepublicEarly-demographic dividendEast Asia & PacificEast Asia & Pacific (excluding high income)East Asia & Pacific (IDA & IBRD countries)EcuadorEgypt, Arab Rep.El SalvadorEquatorial GuineaEritreaEstoniaEthiopiaEuro areaEurope & Central AsiaEurope & Central Asia (excluding high income)Europe & Central Asia (IDA & IBRD countries)European UnionFaroe IslandsFijiFinlandFragile and conflict affected situationsFranceFrench PolynesiaGabonGambia, TheGeorgiaGermanyGhanaGreeceGreenlandGrenadaGuatemalaGuineaGuinea-BissauGuyanaHaitiHeavily indebted poor countries (HIPC)High incomeHondurasHong Kong SAR, ChinaHungaryIBRD onlyIcelandIDA & IBRD totalIDA blendIDA onlyIDA totalIndiaIndonesiaIran, Islamic Rep.IraqIrelandIsraelItalyJamaicaJapanJordanKazakhstanKenyaKiribatiKorea, Rep.KuwaitKyrgyz RepublicLao PDRLate-demographic dividendLatin America & Caribbean Latin America & Caribbean (excluding high income)Latin America & the Caribbean (IDA & IBRD countries)LatviaLeast developed countries: UN classificationLebanonLesothoLiberiaLibyaLithuaniaLow & middle incomeLow incomeLower middle incomeLuxembourgMacao SAR, ChinaMacedonia, FYRMadagascarMalawiMalaysiaMaldivesMaliMaltaMauritaniaMauritiusMexicoMiddle East & North AfricaMiddle East & North Africa (excluding high income)Middle East & North Africa (IDA & IBRD countries)Middle incomeMoldovaMongoliaMoroccoMozambiqueMyanmarNamibiaNepalNetherlandsNew CaledoniaNew ZealandNicaraguaNigerNigeriaNorth AmericaNorwayOECD membersOmanOther small statesPacific island small statesPakistanPalauPanamaPapua New GuineaParaguayPeruPhilippinesPolandPortugalPost-demographic dividendPre-demographic dividendQatarRomaniaRussian FederationRwandaSamoaSao Tome and PrincipeSaudi ArabiaSenegalSerbiaSeychellesSierra LeoneSingaporeSlovak RepublicSloveniaSmall statesSolomon IslandsSomaliaSouth AfricaSouth AsiaSouth Asia (IDA & IBRD)SpainSri LankaSt. Kitts and NevisSt. LuciaSt. Vincent and the GrenadinesSub-Saharan Africa Sub-Saharan Africa (excluding high income)Sub-Saharan Africa (IDA & IBRD countries)SudanSurinameSwazilandSwedenSwitzerlandSyrian Arab RepublicTajikistanTanzaniaThailandTimor-LesteTogoTongaTrinidad and TobagoTunisiaTurkeyTurkmenistanTurks and Caicos IslandsTuvaluUgandaUkraineUnited Arab EmiratesUnited KingdomUnited StatesUpper middle incomeUruguayVanuatuVenezuela, RBVietnamVirgin Islands (U.S.)WorldYemen, Rep.ZambiaZimbabwe Timeline:
This timeline shows a graph from 1963 to 2016 of Sri Lanka. No data until 1962. Number of actual observations by date: 49.
Source name:
World Development Indicators
Source organization:
World Bank staff estimates from the Comtrade database maintained by the United Nations Statistics Division.
Categories, topics:
Private Sector, Trade
Last updated:
apr 23, 2017
Indicators value changes by year
Minimum:
28.853
jan 1, 1976
Maximum:
76.587
jan 1, 2000
At the date of observation
Value
Absolute change
Change from previous value
jan 1, 1963
49.665
+49.665
0.0%
jan 1, 1964
45.03
-4.635
-9.33%
jan 1, 1965
40.305
-4.725
-10.49%
jan 1, 1966
46.033
+5.728
14.21%
jan 1, 1967
42.518
-3.515
-7.63%
jan 1, 1968
42.906
+0.388
0.91%
jan 1, 1969
41.806
-1.101
-2.57%
jan 1, 1970
52.175
+10.369
24.8%
jan 1, 1971
46.816
-5.359
-10.27%
jan 1, 1972
47.867
+1.052
2.25%
jan 1, 1973
44.883
-2.984
-6.23%
jan 1, 1975
29.764
-15.119
-33.68%
jan 1, 1976
28.853
-0.912
-3.06%
jan 1, 1977
34.074
+5.222
18.1%
jan 1, 1978
31.649
-2.426
-7.12%
jan 1, 1979
48.782
+17.134
54.14%
jan 1, 1980
54.614
+5.832
11.96%
jan 1, 1981
52.348
-2.266
-4.15%
jan 1, 1982
52.237
-0.112
-0.21%
jan 1, 1983
52.841
+0.604
1.16%
jan 1, 1984
55.878
+3.037
5.75%
jan 1, 1985
55.951
+0.072
0.13%
jan 1, 1986
54.643
-1.307
-2.34%
jan 1, 1987
66.556
+11.913
21.8%
jan 1, 1988
64.845
-1.711
-2.57%
jan 1, 1989
64.85
+0.005
0.01%
jan 1, 1990
64.546
-0.304
-0.47%
jan 1, 1991
64.881
+0.335
0.52%
jan 1, 1992
67.776
+2.895
4.46%
jan 1, 1993
71.565
+3.789
5.59%
jan 1, 1994
74.938
+3.373
4.71%
jan 1, 1995
74.737
-0.201
-0.27%
jan 1, 2000
76.587
+1.85
2.48%
jan 1, 2001
74.795
-1.793
-2.34%
jan 1, 2002
73.497
-1.297
-1.73%
jan 1, 2003
67.077
-6.42
-8.73%
jan 1, 2004
71.294
+4.217
6.29%
jan 1, 2005
68.726
-2.568
-3.6%
jan 1, 2006
69.249
+0.523
0.76%
jan 1, 2007
66.412
-2.836
-4.1%
jan 1, 2008
59.488
-6.924
-10.43%
jan 1, 2009
60.075
+0.587
0.99%
jan 1, 2010
62.281
+2.206
3.67%
jan 1, 2011
64.53
+2.249
3.61%
jan 1, 2012
62.748
-1.782
-2.76%
jan 1, 2013
63.498
+0.751
1.2%
jan 1, 2014
61.372
-2.127
-3.35%
jan 1, 2015
60.876
-0.496
-0.81%
jan 1, 2016
69.251
+8.375
13.76%
Ranking of countries by current statistics by years


Comments: