29
/
en
AIzaSyAYiBZKx7MnpbEhh9jyipgxe19OcubqV5w
April 1, 2024
161705
Italy
ITA
true
2
1
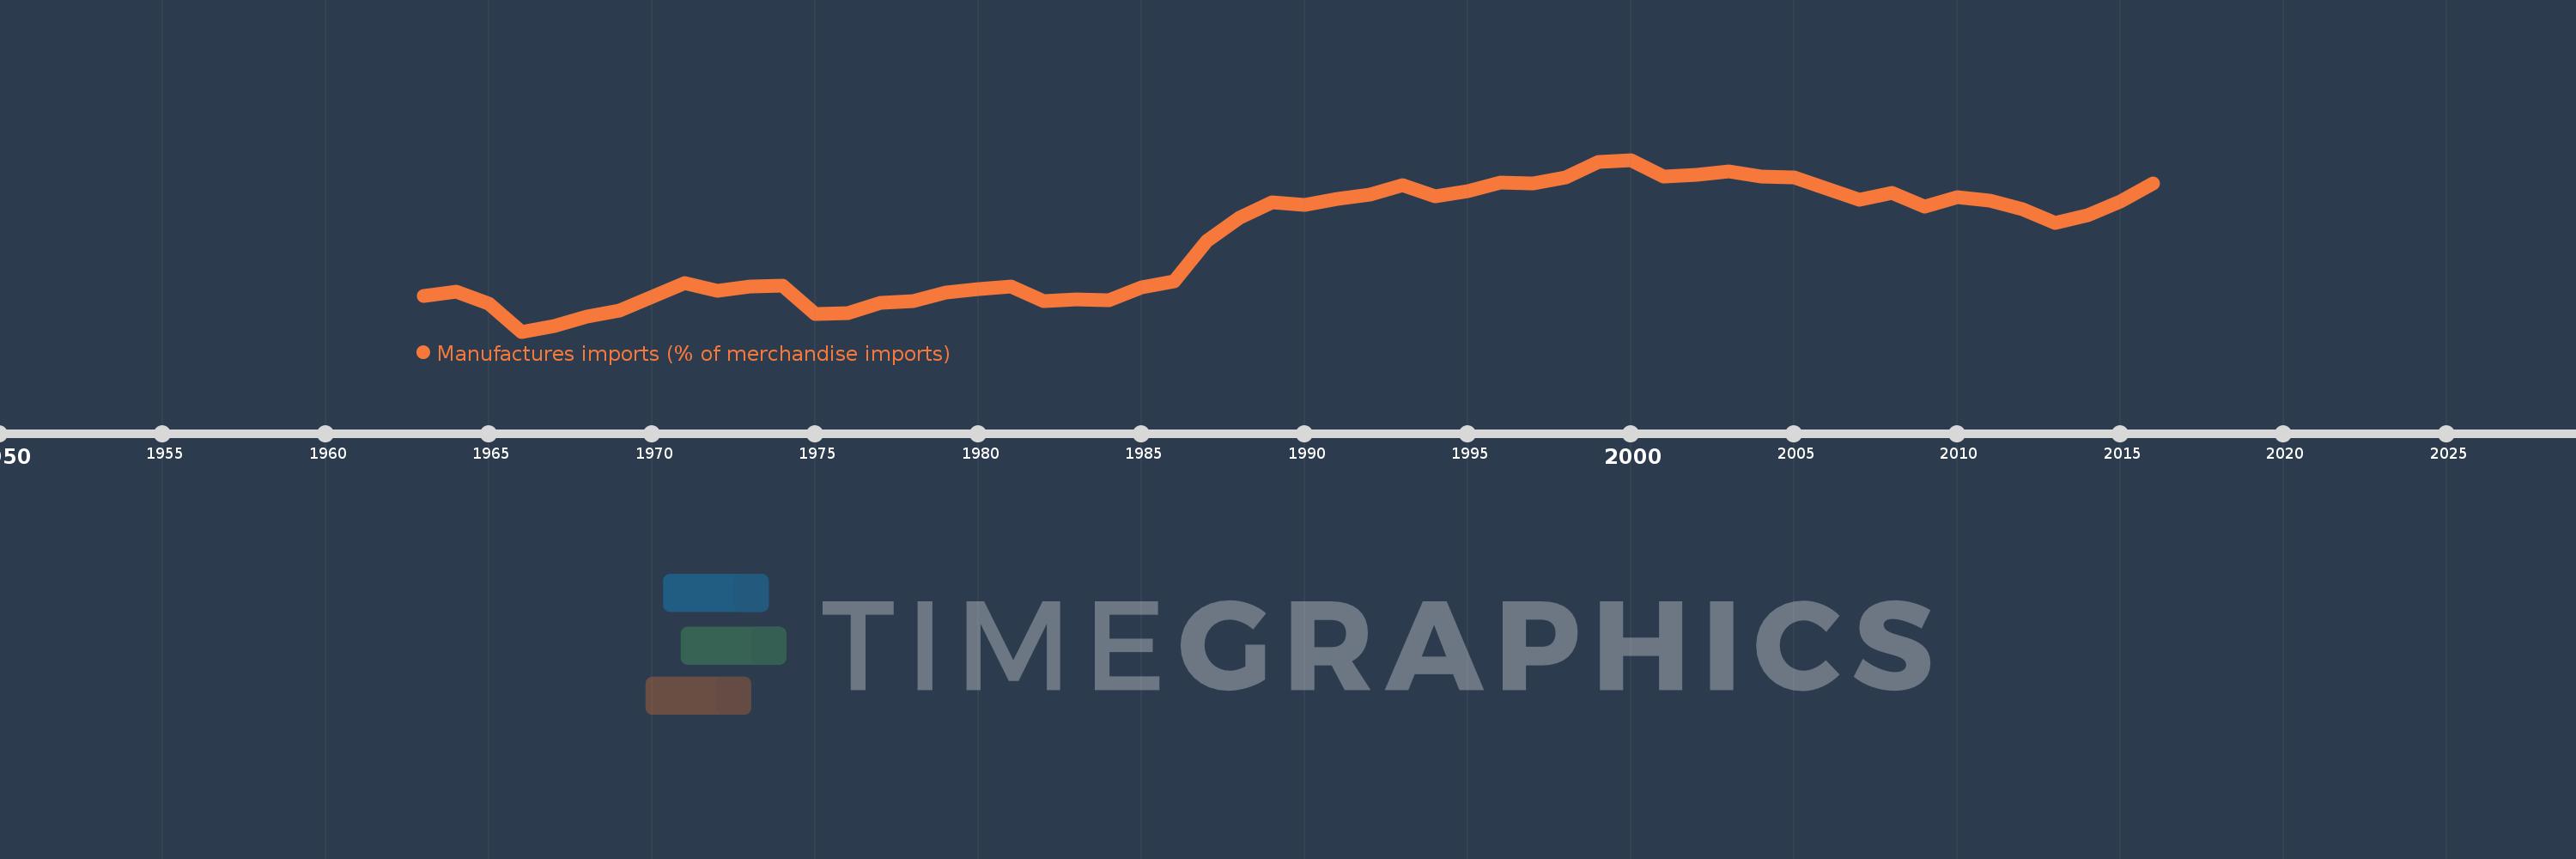
Manufactures imports (% of merchandise imports)
2016,2015,2014,2013,2012,2011,2010,2009,2008,2007,2006,2005,2004,2003,2002,2001,2000,1999,1998,1997,1996,1995,1994,1993,1992,1991,1990,1989,1988,1987,1986,1985,1984,1983,1982,1981,1980,1979,1978,1977,1976,1975,1974,1973,1972,1971,1970,1969,1968,1967,1966,1965,1964,1963
This statistics in other country:
AfghanistanAlbaniaAlgeriaAndorraAngolaAntigua and BarbudaArab WorldArgentinaArmeniaArubaAustraliaAustriaAzerbaijanBahamas, TheBahrainBangladeshBarbadosBelarusBelgiumBelizeBeninBermudaBhutanBoliviaBosnia and HerzegovinaBotswanaBrazilBrunei DarussalamBulgariaBurkina FasoBurundiCabo VerdeCambodiaCameroonCanadaCaribbean small statesCayman IslandsCentral African RepublicCentral Europe and the BalticsChadChileChinaColombiaComorosCongo, Dem. Rep.Congo, Rep.Costa RicaCote d'IvoireCroatiaCubaCyprusCzech RepublicDenmarkDjiboutiDominicaDominican RepublicEarly-demographic dividendEast Asia & PacificEast Asia & Pacific (excluding high income)East Asia & Pacific (IDA & IBRD countries)EcuadorEgypt, Arab Rep.El SalvadorEquatorial GuineaEritreaEstoniaEthiopiaEuro areaEurope & Central AsiaEurope & Central Asia (excluding high income)Europe & Central Asia (IDA & IBRD countries)European UnionFaroe IslandsFijiFinlandFragile and conflict affected situationsFranceFrench PolynesiaGabonGambia, TheGeorgiaGermanyGhanaGreeceGreenlandGrenadaGuatemalaGuineaGuinea-BissauGuyanaHaitiHeavily indebted poor countries (HIPC)High incomeHondurasHong Kong SAR, ChinaHungaryIBRD onlyIcelandIDA & IBRD totalIDA blendIDA onlyIDA totalIndiaIndonesiaIran, Islamic Rep.IraqIrelandIsraelItalyJamaicaJapanJordanKazakhstanKenyaKiribatiKorea, Rep.KuwaitKyrgyz RepublicLao PDRLate-demographic dividendLatin America & Caribbean Latin America & Caribbean (excluding high income)Latin America & the Caribbean (IDA & IBRD countries)LatviaLeast developed countries: UN classificationLebanonLesothoLiberiaLibyaLithuaniaLow & middle incomeLow incomeLower middle incomeLuxembourgMacao SAR, ChinaMacedonia, FYRMadagascarMalawiMalaysiaMaldivesMaliMaltaMauritaniaMauritiusMexicoMiddle East & North AfricaMiddle East & North Africa (excluding high income)Middle East & North Africa (IDA & IBRD countries)Middle incomeMoldovaMongoliaMoroccoMozambiqueMyanmarNamibiaNepalNetherlandsNew CaledoniaNew ZealandNicaraguaNigerNigeriaNorth AmericaNorwayOECD membersOmanOther small statesPacific island small statesPakistanPalauPanamaPapua New GuineaParaguayPeruPhilippinesPolandPortugalPost-demographic dividendPre-demographic dividendQatarRomaniaRussian FederationRwandaSamoaSao Tome and PrincipeSaudi ArabiaSenegalSerbiaSeychellesSierra LeoneSingaporeSlovak RepublicSloveniaSmall statesSolomon IslandsSomaliaSouth AfricaSouth AsiaSouth Asia (IDA & IBRD)SpainSri LankaSt. Kitts and NevisSt. LuciaSt. Vincent and the GrenadinesSub-Saharan Africa Sub-Saharan Africa (excluding high income)Sub-Saharan Africa (IDA & IBRD countries)SudanSurinameSwazilandSwedenSwitzerlandSyrian Arab RepublicTajikistanTanzaniaThailandTimor-LesteTogoTongaTrinidad and TobagoTunisiaTurkeyTurkmenistanTurks and Caicos IslandsTuvaluUgandaUkraineUnited Arab EmiratesUnited KingdomUnited StatesUpper middle incomeUruguayVanuatuVenezuela, RBVietnamVirgin Islands (U.S.)WorldYemen, Rep.ZambiaZimbabwe Timeline:
This timeline shows a graph from 1963 to 2016 of Italy. No data until 1962. Number of actual observations by date: 54.
Source name:
World Development Indicators
Source organization:
World Bank staff estimates from the Comtrade database maintained by the United Nations Statistics Division.
Categories, topics:
Private Sector, Trade
Last updated:
apr 23, 2017
Indicators value changes by year
Minimum:
35.469
jan 1, 1966
Maximum:
72.666
jan 1, 2000
At the date of observation
Value
Absolute change
Change from previous value
jan 1, 1963
43.18
+43.18
0.0%
jan 1, 1964
44.025
+0.845
1.96%
jan 1, 1965
41.431
-2.593
-5.89%
jan 1, 1966
35.469
-5.962
-14.39%
jan 1, 1967
36.616
+1.147
3.24%
jan 1, 1968
38.735
+2.119
5.79%
jan 1, 1969
40.094
+1.359
3.51%
jan 1, 1970
42.918
+2.824
7.04%
jan 1, 1971
46.047
+3.129
7.29%
jan 1, 1972
44.393
-1.654
-3.59%
jan 1, 1973
45.316
+0.923
2.08%
jan 1, 1974
45.498
+0.182
0.4%
jan 1, 1975
39.25
-6.248
-13.73%
jan 1, 1976
39.548
+0.297
0.76%
jan 1, 1977
41.617
+2.069
5.23%
jan 1, 1978
42.143
+0.527
1.27%
jan 1, 1979
43.91
+1.767
4.19%
jan 1, 1980
44.719
+0.809
1.84%
jan 1, 1981
45.294
+0.575
1.29%
jan 1, 1982
42.114
-3.18
-7.02%
jan 1, 1983
42.429
+0.315
0.75%
jan 1, 1984
42.342
-0.087
-0.2%
jan 1, 1985
45.089
+2.747
6.49%
jan 1, 1986
46.413
+1.323
2.94%
jan 1, 1987
55.14
+8.727
18.8%
jan 1, 1988
60.167
+5.027
9.12%
jan 1, 1989
63.374
+3.207
5.33%
jan 1, 1990
62.952
-0.422
-0.67%
jan 1, 1991
64.293
+1.34
2.13%
jan 1, 1992
65.067
+0.774
1.2%
jan 1, 1993
67.128
+2.062
3.17%
jan 1, 1994
64.679
-2.449
-3.65%
jan 1, 1995
65.893
+1.214
1.88%
jan 1, 1996
67.703
+1.81
2.75%
jan 1, 1997
67.629
-0.074
-0.11%
jan 1, 1998
68.862
+1.233
1.82%
jan 1, 1999
72.217
+3.355
4.87%
jan 1, 2000
72.666
+0.449
0.62%
jan 1, 2001
69.105
-3.562
-4.9%
jan 1, 2002
69.456
+0.351
0.51%
jan 1, 2003
70.243
+0.786
1.13%
jan 1, 2004
69.091
-1.152
-1.64%
jan 1, 2005
68.846
-0.245
-0.36%
jan 1, 2006
66.413
-2.432
-3.53%
jan 1, 2007
63.992
-2.421
-3.65%
jan 1, 2008
65.452
+1.46
2.28%
jan 1, 2009
62.455
-2.997
-4.58%
jan 1, 2010
64.609
+2.154
3.45%
jan 1, 2011
63.761
-0.848
-1.31%
jan 1, 2012
61.939
-1.823
-2.86%
jan 1, 2013
59.026
-2.912
-4.7%
jan 1, 2014
60.73
+1.704
2.89%
jan 1, 2015
63.714
+2.984
4.91%
jan 1, 2016
67.601
+3.887
6.1%
Ranking of countries by current statistics by years


Comments: