29
/
en
AIzaSyAYiBZKx7MnpbEhh9jyipgxe19OcubqV5w
April 1, 2024
41647
Latin America & Caribbean
LCN
false
2
1
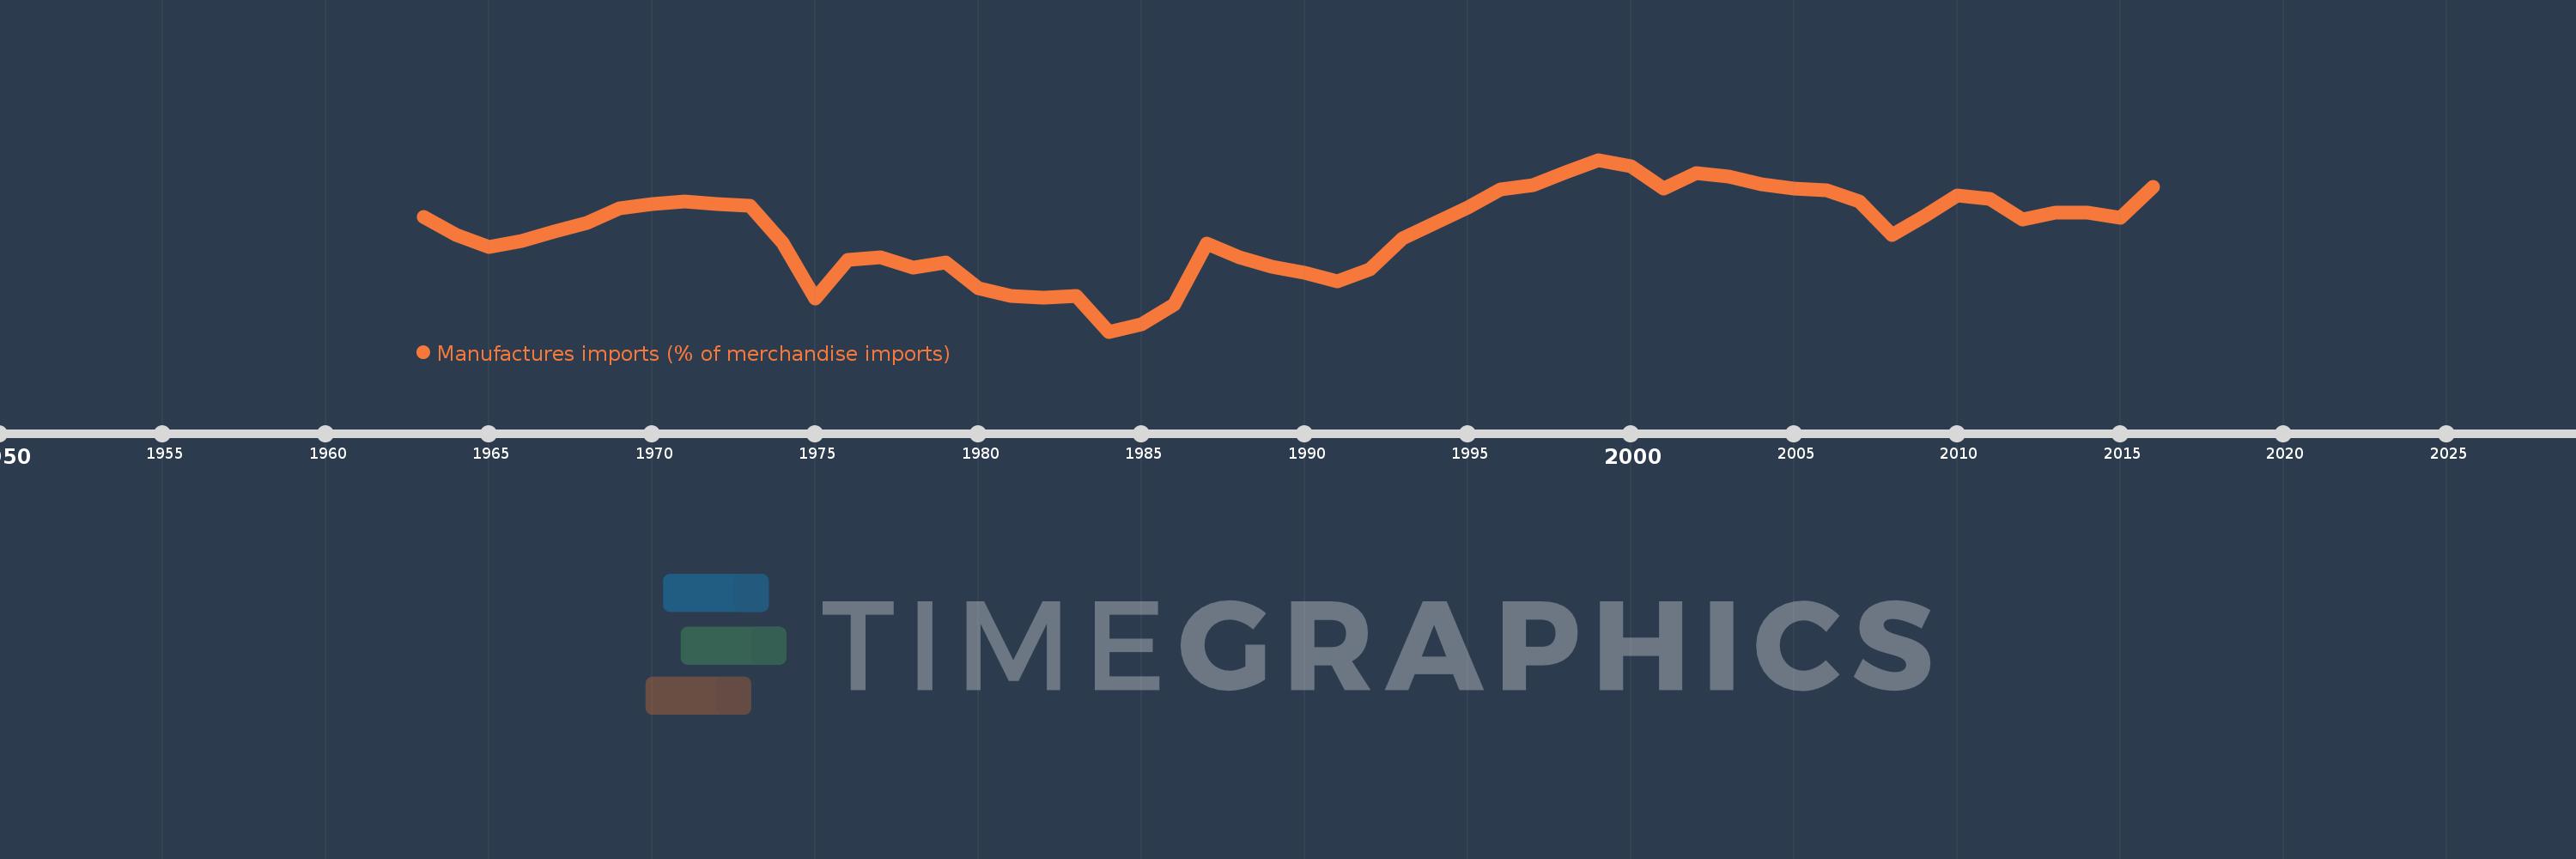
Manufactures imports (% of merchandise imports)
2016,2015,2014,2013,2012,2011,2010,2009,2008,2007,2006,2005,2004,2003,2002,2001,2000,1999,1998,1997,1996,1995,1994,1993,1992,1991,1990,1989,1988,1987,1986,1985,1984,1983,1982,1981,1980,1979,1978,1977,1976,1975,1974,1973,1972,1971,1970,1969,1968,1967,1966,1965,1964,1963
This statistics in other country:
AfghanistanAlbaniaAlgeriaAndorraAngolaAntigua and BarbudaArab WorldArgentinaArmeniaArubaAustraliaAustriaAzerbaijanBahamas, TheBahrainBangladeshBarbadosBelarusBelgiumBelizeBeninBermudaBhutanBoliviaBosnia and HerzegovinaBotswanaBrazilBrunei DarussalamBulgariaBurkina FasoBurundiCabo VerdeCambodiaCameroonCanadaCaribbean small statesCayman IslandsCentral African RepublicCentral Europe and the BalticsChadChileChinaColombiaComorosCongo, Dem. Rep.Congo, Rep.Costa RicaCote d'IvoireCroatiaCubaCyprusCzech RepublicDenmarkDjiboutiDominicaDominican RepublicEarly-demographic dividendEast Asia & PacificEast Asia & Pacific (excluding high income)East Asia & Pacific (IDA & IBRD countries)EcuadorEgypt, Arab Rep.El SalvadorEquatorial GuineaEritreaEstoniaEthiopiaEuro areaEurope & Central AsiaEurope & Central Asia (excluding high income)Europe & Central Asia (IDA & IBRD countries)European UnionFaroe IslandsFijiFinlandFragile and conflict affected situationsFranceFrench PolynesiaGabonGambia, TheGeorgiaGermanyGhanaGreeceGreenlandGrenadaGuatemalaGuineaGuinea-BissauGuyanaHaitiHeavily indebted poor countries (HIPC)High incomeHondurasHong Kong SAR, ChinaHungaryIBRD onlyIcelandIDA & IBRD totalIDA blendIDA onlyIDA totalIndiaIndonesiaIran, Islamic Rep.IraqIrelandIsraelItalyJamaicaJapanJordanKazakhstanKenyaKiribatiKorea, Rep.KuwaitKyrgyz RepublicLao PDRLate-demographic dividendLatin America & Caribbean Latin America & Caribbean (excluding high income)Latin America & the Caribbean (IDA & IBRD countries)LatviaLeast developed countries: UN classificationLebanonLesothoLiberiaLibyaLithuaniaLow & middle incomeLow incomeLower middle incomeLuxembourgMacao SAR, ChinaMacedonia, FYRMadagascarMalawiMalaysiaMaldivesMaliMaltaMauritaniaMauritiusMexicoMiddle East & North AfricaMiddle East & North Africa (excluding high income)Middle East & North Africa (IDA & IBRD countries)Middle incomeMoldovaMongoliaMoroccoMozambiqueMyanmarNamibiaNepalNetherlandsNew CaledoniaNew ZealandNicaraguaNigerNigeriaNorth AmericaNorwayOECD membersOmanOther small statesPacific island small statesPakistanPalauPanamaPapua New GuineaParaguayPeruPhilippinesPolandPortugalPost-demographic dividendPre-demographic dividendQatarRomaniaRussian FederationRwandaSamoaSao Tome and PrincipeSaudi ArabiaSenegalSerbiaSeychellesSierra LeoneSingaporeSlovak RepublicSloveniaSmall statesSolomon IslandsSomaliaSouth AfricaSouth AsiaSouth Asia (IDA & IBRD)SpainSri LankaSt. Kitts and NevisSt. LuciaSt. Vincent and the GrenadinesSub-Saharan Africa Sub-Saharan Africa (excluding high income)Sub-Saharan Africa (IDA & IBRD countries)SudanSurinameSwazilandSwedenSwitzerlandSyrian Arab RepublicTajikistanTanzaniaThailandTimor-LesteTogoTongaTrinidad and TobagoTunisiaTurkeyTurkmenistanTurks and Caicos IslandsTuvaluUgandaUkraineUnited Arab EmiratesUnited KingdomUnited StatesUpper middle incomeUruguayVanuatuVenezuela, RBVietnamVirgin Islands (U.S.)WorldYemen, Rep.ZambiaZimbabwe Timeline:
This timeline shows a graph from 1963 to 2016 of Latin America & Caribbean . No data until 1962. Number of actual observations by date: 54.
Source name:
World Development Indicators
Source organization:
World Bank staff estimates from the Comtrade database maintained by the United Nations Statistics Division.
Categories, topics:
Private Sector, Trade
Last updated:
apr 23, 2017
Indicators value changes by year
Minimum:
60.255
jan 1, 1984
Maximum:
80.561
jan 1, 1999
At the date of observation
Value
Absolute change
Change from previous value
jan 1, 1963
73.828
+73.828
0.0%
jan 1, 1964
71.69
-2.138
-2.9%
jan 1, 1965
70.215
-1.475
-2.06%
jan 1, 1966
70.923
+0.709
1.01%
jan 1, 1967
72.109
+1.186
1.67%
jan 1, 1968
73.098
+0.989
1.37%
jan 1, 1969
74.835
+1.737
2.38%
jan 1, 1970
75.301
+0.466
0.62%
jan 1, 1971
75.678
+0.377
0.5%
jan 1, 1972
75.325
-0.353
-0.47%
jan 1, 1973
75.079
-0.246
-0.33%
jan 1, 1974
70.786
-4.292
-5.72%
jan 1, 1975
64.198
-6.588
-9.31%
jan 1, 1976
68.761
+4.563
7.11%
jan 1, 1977
69.072
+0.311
0.45%
jan 1, 1978
67.821
-1.25
-1.81%
jan 1, 1979
68.401
+0.58
0.86%
jan 1, 1980
65.338
-3.063
-4.48%
jan 1, 1981
64.426
-0.912
-1.4%
jan 1, 1982
64.265
-0.161
-0.25%
jan 1, 1983
64.496
+0.231
0.36%
jan 1, 1984
60.255
-4.241
-6.58%
jan 1, 1985
61.129
+0.875
1.45%
jan 1, 1986
63.491
+2.361
3.86%
jan 1, 1987
70.659
+7.168
11.29%
jan 1, 1988
69.045
-1.614
-2.28%
jan 1, 1989
67.961
-1.084
-1.57%
jan 1, 1990
67.213
-0.748
-1.1%
jan 1, 1991
66.232
-0.98
-1.46%
jan 1, 1992
67.575
+1.343
2.03%
jan 1, 1993
71.227
+3.651
5.4%
jan 1, 1994
73.073
+1.847
2.59%
jan 1, 1995
74.957
+1.883
2.58%
jan 1, 1996
77.106
+2.149
2.87%
jan 1, 1997
77.548
+0.443
0.57%
jan 1, 1998
79.115
+1.566
2.02%
jan 1, 1999
80.561
+1.447
1.83%
jan 1, 2000
79.778
-0.784
-0.97%
jan 1, 2001
77.186
-2.591
-3.25%
jan 1, 2002
79.012
+1.826
2.37%
jan 1, 2003
78.582
-0.43
-0.54%
jan 1, 2004
77.632
-0.95
-1.21%
jan 1, 2005
77.128
-0.503
-0.65%
jan 1, 2006
76.992
-0.136
-0.18%
jan 1, 2007
75.622
-1.37
-1.78%
jan 1, 2008
71.697
-3.925
-5.19%
jan 1, 2009
73.862
+2.164
3.02%
jan 1, 2010
76.376
+2.514
3.4%
jan 1, 2011
75.902
-0.474
-0.62%
jan 1, 2012
73.527
-2.374
-3.13%
jan 1, 2013
74.311
+0.784
1.07%
jan 1, 2014
74.278
-0.032
-0.04%
jan 1, 2015
73.707
-0.571
-0.77%
jan 1, 2016
77.386
+3.678
4.99%
Ranking of countries by current statistics by years


Comments: