29
/
en
AIzaSyAYiBZKx7MnpbEhh9jyipgxe19OcubqV5w
April 1, 2024
66263
Algeria
DZA
true
2
1
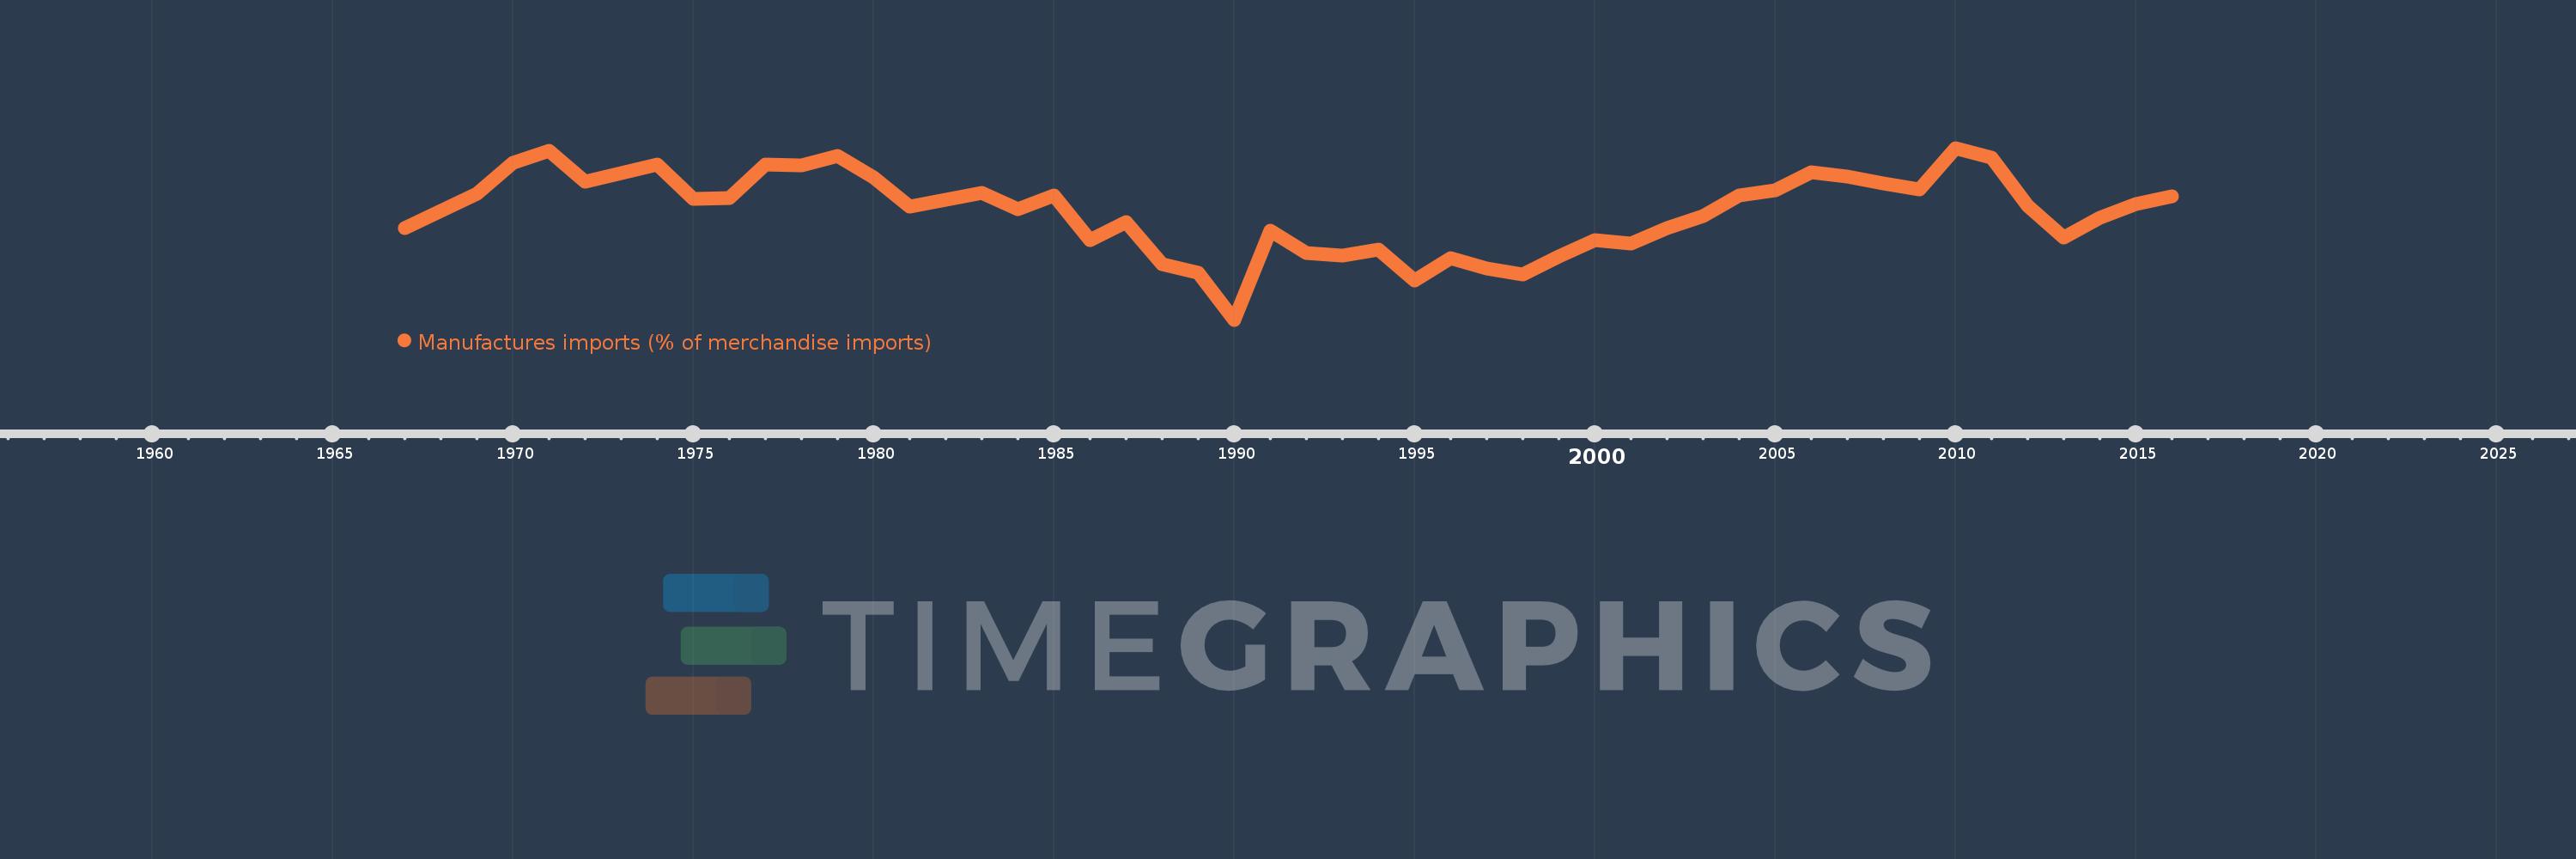
Manufactures imports (% of merchandise imports)
2016,2015,2014,2013,2012,2011,2010,2009,2008,2007,2006,2005,2004,2003,2002,2001,2000,1999,1998,1997,1996,1995,1994,1993,1992,1991,1990,1989,1988,1987,1986,1985,1984,1983,1982,1981,1980,1979,1978,1977,1976,1975,1974,1972,1971,1970,1969,1967
This statistics in other country:
AfghanistanAlbaniaAlgeriaAndorraAngolaAntigua and BarbudaArab WorldArgentinaArmeniaArubaAustraliaAustriaAzerbaijanBahamas, TheBahrainBangladeshBarbadosBelarusBelgiumBelizeBeninBermudaBhutanBoliviaBosnia and HerzegovinaBotswanaBrazilBrunei DarussalamBulgariaBurkina FasoBurundiCabo VerdeCambodiaCameroonCanadaCaribbean small statesCayman IslandsCentral African RepublicCentral Europe and the BalticsChadChileChinaColombiaComorosCongo, Dem. Rep.Congo, Rep.Costa RicaCote d'IvoireCroatiaCubaCyprusCzech RepublicDenmarkDjiboutiDominicaDominican RepublicEarly-demographic dividendEast Asia & PacificEast Asia & Pacific (excluding high income)East Asia & Pacific (IDA & IBRD countries)EcuadorEgypt, Arab Rep.El SalvadorEquatorial GuineaEritreaEstoniaEthiopiaEuro areaEurope & Central AsiaEurope & Central Asia (excluding high income)Europe & Central Asia (IDA & IBRD countries)European UnionFaroe IslandsFijiFinlandFragile and conflict affected situationsFranceFrench PolynesiaGabonGambia, TheGeorgiaGermanyGhanaGreeceGreenlandGrenadaGuatemalaGuineaGuinea-BissauGuyanaHaitiHeavily indebted poor countries (HIPC)High incomeHondurasHong Kong SAR, ChinaHungaryIBRD onlyIcelandIDA & IBRD totalIDA blendIDA onlyIDA totalIndiaIndonesiaIran, Islamic Rep.IraqIrelandIsraelItalyJamaicaJapanJordanKazakhstanKenyaKiribatiKorea, Rep.KuwaitKyrgyz RepublicLao PDRLate-demographic dividendLatin America & Caribbean Latin America & Caribbean (excluding high income)Latin America & the Caribbean (IDA & IBRD countries)LatviaLeast developed countries: UN classificationLebanonLesothoLiberiaLibyaLithuaniaLow & middle incomeLow incomeLower middle incomeLuxembourgMacao SAR, ChinaMacedonia, FYRMadagascarMalawiMalaysiaMaldivesMaliMaltaMauritaniaMauritiusMexicoMiddle East & North AfricaMiddle East & North Africa (excluding high income)Middle East & North Africa (IDA & IBRD countries)Middle incomeMoldovaMongoliaMoroccoMozambiqueMyanmarNamibiaNepalNetherlandsNew CaledoniaNew ZealandNicaraguaNigerNigeriaNorth AmericaNorwayOECD membersOmanOther small statesPacific island small statesPakistanPalauPanamaPapua New GuineaParaguayPeruPhilippinesPolandPortugalPost-demographic dividendPre-demographic dividendQatarRomaniaRussian FederationRwandaSamoaSao Tome and PrincipeSaudi ArabiaSenegalSerbiaSeychellesSierra LeoneSingaporeSlovak RepublicSloveniaSmall statesSolomon IslandsSomaliaSouth AfricaSouth AsiaSouth Asia (IDA & IBRD)SpainSri LankaSt. Kitts and NevisSt. LuciaSt. Vincent and the GrenadinesSub-Saharan Africa Sub-Saharan Africa (excluding high income)Sub-Saharan Africa (IDA & IBRD countries)SudanSurinameSwazilandSwedenSwitzerlandSyrian Arab RepublicTajikistanTanzaniaThailandTimor-LesteTogoTongaTrinidad and TobagoTunisiaTurkeyTurkmenistanTurks and Caicos IslandsTuvaluUgandaUkraineUnited Arab EmiratesUnited KingdomUnited StatesUpper middle incomeUruguayVanuatuVenezuela, RBVietnamVirgin Islands (U.S.)WorldYemen, Rep.ZambiaZimbabwe Timeline:
This timeline shows a graph from 1967 to 2016 of Algeria. No data until 1966. Number of actual observations by date: 48.
Source name:
World Development Indicators
Source organization:
World Bank staff estimates from the Comtrade database maintained by the United Nations Statistics Division.
Categories, topics:
Private Sector, Trade
Last updated:
apr 23, 2017
Indicators value changes by year
Minimum:
56.099
jan 1, 1990
At the date of observation
Value
Absolute change
Change from previous value
jan 1, 1967
68.698
+68.698
0.0%
jan 1, 1969
73.464
+4.766
6.94%
jan 1, 1970
77.659
+4.194
5.71%
jan 1, 1971
79.326
+1.667
2.15%
jan 1, 1972
75.108
-4.217
-5.32%
jan 1, 1974
77.419
+2.311
3.08%
jan 1, 1975
72.69
-4.73
-6.11%
jan 1, 1976
72.857
+0.168
0.23%
jan 1, 1977
77.474
+4.617
6.34%
jan 1, 1978
77.338
-0.136
-0.18%
jan 1, 1979
78.65
+1.312
1.7%
jan 1, 1980
75.691
-2.959
-3.76%
jan 1, 1981
71.713
-3.979
-5.26%
jan 1, 1982
72.6
+0.887
1.24%
jan 1, 1983
73.542
+0.943
1.3%
jan 1, 1984
71.301
-2.241
-3.05%
jan 1, 1985
73.165
+1.864
2.61%
jan 1, 1986
67.019
-6.146
-8.4%
jan 1, 1987
69.511
+2.492
3.72%
jan 1, 1988
63.768
-5.743
-8.26%
jan 1, 1989
62.608
-1.16
-1.82%
jan 1, 1990
56.099
-6.509
-10.4%
jan 1, 1991
68.398
+12.299
21.92%
jan 1, 1992
65.274
-3.124
-4.57%
jan 1, 1993
64.897
-0.377
-0.58%
jan 1, 1994
65.727
+0.83
1.28%
jan 1, 1995
61.499
-4.228
-6.43%
jan 1, 1996
64.623
+3.124
5.08%
jan 1, 1997
63.115
-1.508
-2.33%
jan 1, 1998
62.305
-0.809
-1.28%
jan 1, 1999
64.773
+2.468
3.96%
jan 1, 2000
67.099
+2.326
3.59%
jan 1, 2001
66.614
-0.485
-0.72%
jan 1, 2002
68.742
+2.128
3.19%
jan 1, 2003
70.314
+1.572
2.29%
jan 1, 2004
73.169
+2.855
4.06%
jan 1, 2005
73.933
+0.764
1.04%
jan 1, 2006
76.456
+2.523
3.41%
jan 1, 2007
75.797
-0.658
-0.86%
jan 1, 2008
74.88
-0.918
-1.21%
jan 1, 2009
73.987
-0.893
-1.19%
jan 1, 2010
79.75
+5.764
7.79%
jan 1, 2011
78.434
-1.316
-1.65%
jan 1, 2012
71.752
-6.682
-8.52%
jan 1, 2013
67.402
-4.35
-6.06%
jan 1, 2014
70.113
+2.712
4.02%
jan 1, 2015
71.999
+1.886
2.69%
jan 1, 2016
73.117
+1.118
1.55%
Ranking of countries by current statistics by years


Comments: