29
/
en
AIzaSyAYiBZKx7MnpbEhh9jyipgxe19OcubqV5w
April 1, 2024
79672
Barbados
BRB
true
2
1
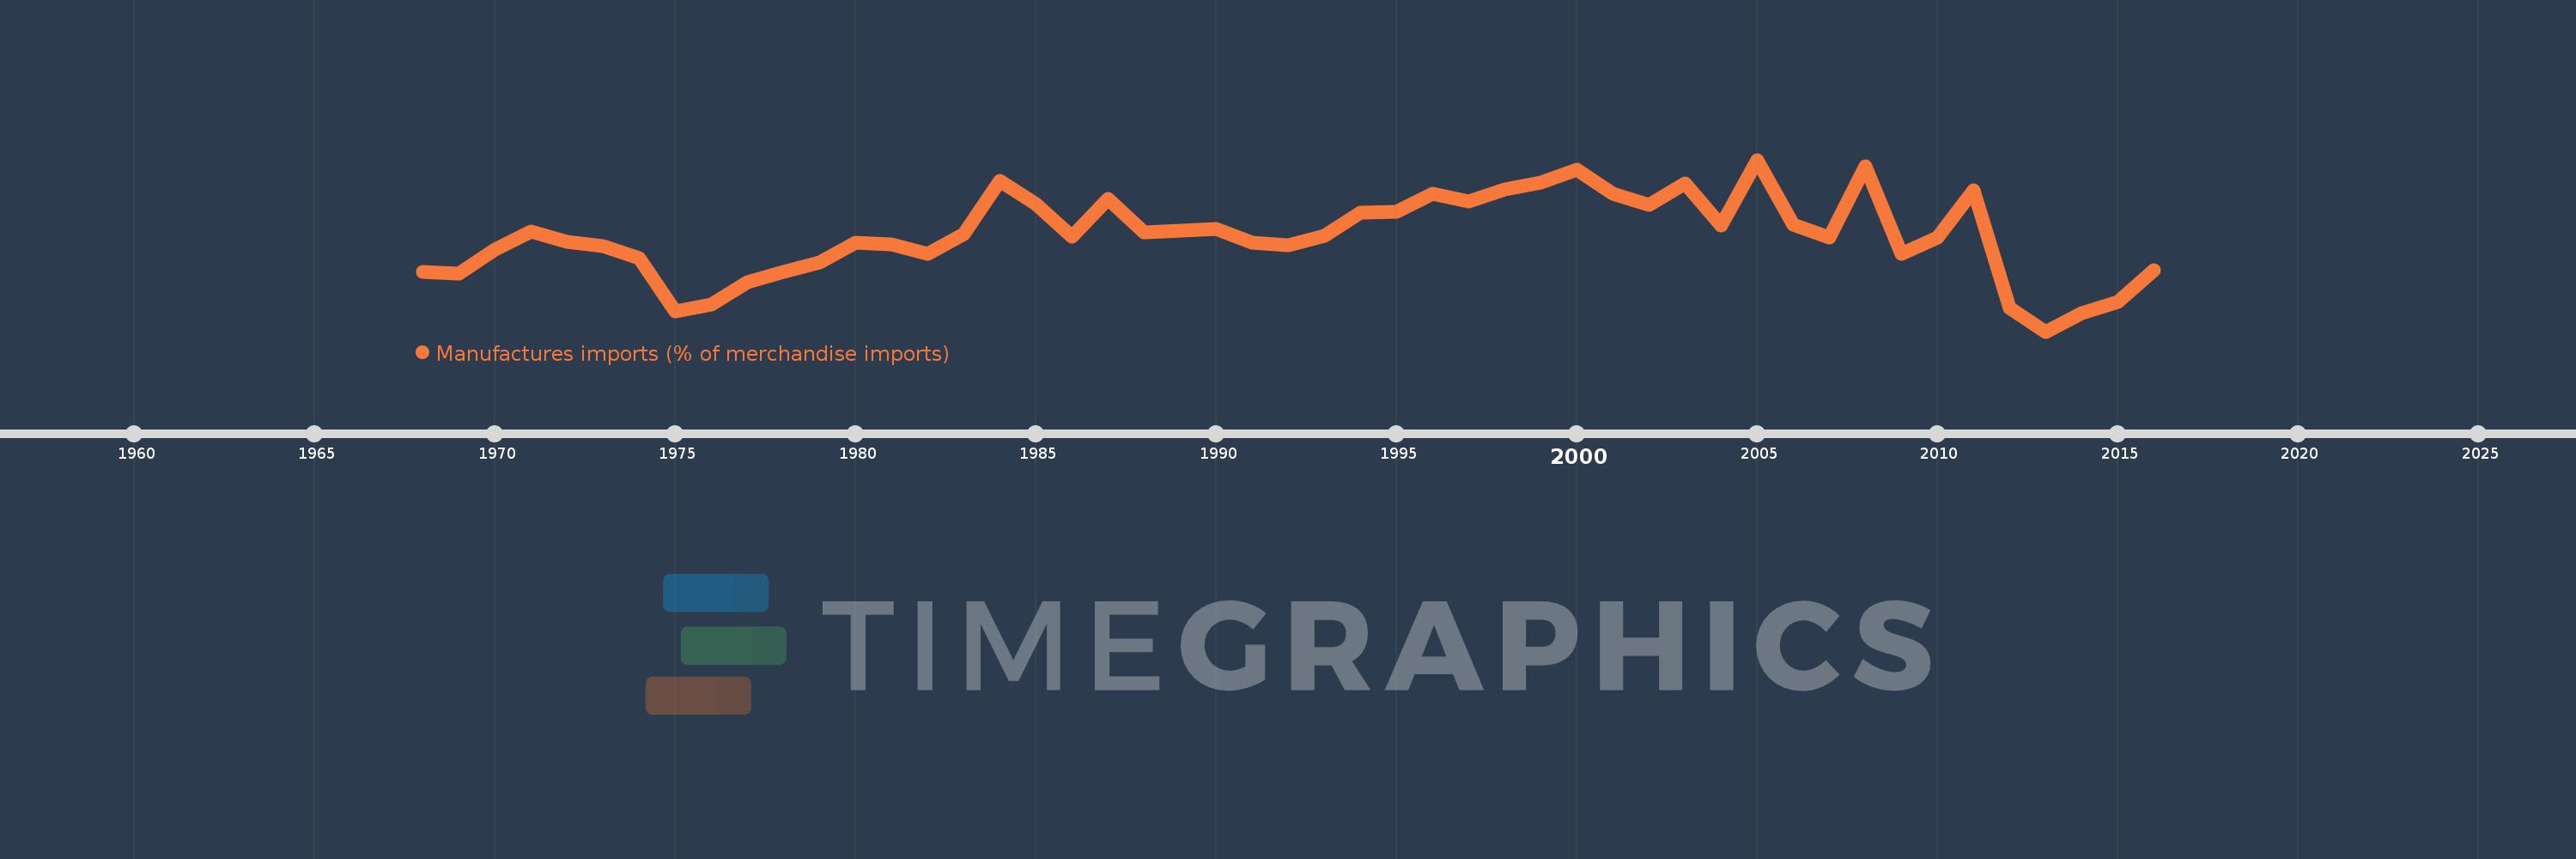
Manufactures imports (% of merchandise imports)
2016,2015,2014,2013,2012,2011,2010,2009,2008,2007,2006,2005,2004,2003,2002,2001,2000,1999,1998,1997,1996,1995,1994,1993,1992,1991,1990,1989,1988,1987,1986,1985,1984,1983,1982,1981,1980,1979,1978,1977,1976,1975,1974,1973,1972,1971,1970,1969,1968
This statistics in other country:
AfghanistanAlbaniaAlgeriaAndorraAngolaAntigua and BarbudaArab WorldArgentinaArmeniaArubaAustraliaAustriaAzerbaijanBahamas, TheBahrainBangladeshBarbadosBelarusBelgiumBelizeBeninBermudaBhutanBoliviaBosnia and HerzegovinaBotswanaBrazilBrunei DarussalamBulgariaBurkina FasoBurundiCabo VerdeCambodiaCameroonCanadaCaribbean small statesCayman IslandsCentral African RepublicCentral Europe and the BalticsChadChileChinaColombiaComorosCongo, Dem. Rep.Congo, Rep.Costa RicaCote d'IvoireCroatiaCubaCyprusCzech RepublicDenmarkDjiboutiDominicaDominican RepublicEarly-demographic dividendEast Asia & PacificEast Asia & Pacific (excluding high income)East Asia & Pacific (IDA & IBRD countries)EcuadorEgypt, Arab Rep.El SalvadorEquatorial GuineaEritreaEstoniaEthiopiaEuro areaEurope & Central AsiaEurope & Central Asia (excluding high income)Europe & Central Asia (IDA & IBRD countries)European UnionFaroe IslandsFijiFinlandFragile and conflict affected situationsFranceFrench PolynesiaGabonGambia, TheGeorgiaGermanyGhanaGreeceGreenlandGrenadaGuatemalaGuineaGuinea-BissauGuyanaHaitiHeavily indebted poor countries (HIPC)High incomeHondurasHong Kong SAR, ChinaHungaryIBRD onlyIcelandIDA & IBRD totalIDA blendIDA onlyIDA totalIndiaIndonesiaIran, Islamic Rep.IraqIrelandIsraelItalyJamaicaJapanJordanKazakhstanKenyaKiribatiKorea, Rep.KuwaitKyrgyz RepublicLao PDRLate-demographic dividendLatin America & Caribbean Latin America & Caribbean (excluding high income)Latin America & the Caribbean (IDA & IBRD countries)LatviaLeast developed countries: UN classificationLebanonLesothoLiberiaLibyaLithuaniaLow & middle incomeLow incomeLower middle incomeLuxembourgMacao SAR, ChinaMacedonia, FYRMadagascarMalawiMalaysiaMaldivesMaliMaltaMauritaniaMauritiusMexicoMiddle East & North AfricaMiddle East & North Africa (excluding high income)Middle East & North Africa (IDA & IBRD countries)Middle incomeMoldovaMongoliaMoroccoMozambiqueMyanmarNamibiaNepalNetherlandsNew CaledoniaNew ZealandNicaraguaNigerNigeriaNorth AmericaNorwayOECD membersOmanOther small statesPacific island small statesPakistanPalauPanamaPapua New GuineaParaguayPeruPhilippinesPolandPortugalPost-demographic dividendPre-demographic dividendQatarRomaniaRussian FederationRwandaSamoaSao Tome and PrincipeSaudi ArabiaSenegalSerbiaSeychellesSierra LeoneSingaporeSlovak RepublicSloveniaSmall statesSolomon IslandsSomaliaSouth AfricaSouth AsiaSouth Asia (IDA & IBRD)SpainSri LankaSt. Kitts and NevisSt. LuciaSt. Vincent and the GrenadinesSub-Saharan Africa Sub-Saharan Africa (excluding high income)Sub-Saharan Africa (IDA & IBRD countries)SudanSurinameSwazilandSwedenSwitzerlandSyrian Arab RepublicTajikistanTanzaniaThailandTimor-LesteTogoTongaTrinidad and TobagoTunisiaTurkeyTurkmenistanTurks and Caicos IslandsTuvaluUgandaUkraineUnited Arab EmiratesUnited KingdomUnited StatesUpper middle incomeUruguayVanuatuVenezuela, RBVietnamVirgin Islands (U.S.)WorldYemen, Rep.ZambiaZimbabwe Timeline:
This timeline shows a graph from 1968 to 2016 of Barbados. No data until 1967. Number of actual observations by date: 49.
Source name:
World Development Indicators
Source organization:
World Bank staff estimates from the Comtrade database maintained by the United Nations Statistics Division.
Categories, topics:
Private Sector, Trade
Last updated:
apr 23, 2017
Indicators value changes by year
Minimum:
47.867
jan 1, 2013
Maximum:
74.738
jan 1, 2005
At the date of observation
Value
Absolute change
Change from previous value
jan 1, 1968
57.215
+57.215
0.0%
jan 1, 1969
56.885
-0.329
-0.58%
jan 1, 1970
60.654
+3.769
6.62%
jan 1, 1971
63.552
+2.899
4.78%
jan 1, 1972
61.859
-1.693
-2.66%
jan 1, 1973
61.296
-0.563
-0.91%
jan 1, 1974
59.379
-1.917
-3.13%
jan 1, 1975
51.028
-8.351
-14.06%
jan 1, 1976
52.079
+1.05
2.06%
jan 1, 1977
55.642
+3.563
6.84%
jan 1, 1978
57.25
+1.608
2.89%
jan 1, 1979
58.705
+1.455
2.54%
jan 1, 1980
61.8
+3.094
5.27%
jan 1, 1981
61.472
-0.328
-0.53%
jan 1, 1982
59.981
-1.491
-2.42%
jan 1, 1983
63.054
+3.073
5.12%
jan 1, 1984
71.479
+8.425
13.36%
jan 1, 1985
67.754
-3.726
-5.21%
jan 1, 1986
62.652
-5.102
-7.53%
jan 1, 1987
68.644
+5.992
9.56%
jan 1, 1988
63.324
-5.32
-7.75%
jan 1, 1989
63.65
+0.326
0.52%
jan 1, 1990
63.984
+0.334
0.52%
jan 1, 1991
61.76
-2.224
-3.48%
jan 1, 1992
61.369
-0.391
-0.63%
jan 1, 1993
62.845
+1.476
2.4%
jan 1, 1994
66.457
+3.612
5.75%
jan 1, 1995
66.545
+0.089
0.13%
jan 1, 1996
69.428
+2.883
4.33%
jan 1, 1997
68.282
-1.147
-1.65%
jan 1, 1998
70.117
+1.835
2.69%
jan 1, 1999
71.204
+1.087
1.55%
jan 1, 2000
73.127
+1.923
2.7%
jan 1, 2001
69.397
-3.73
-5.1%
jan 1, 2002
67.674
-1.723
-2.48%
jan 1, 2003
70.984
+3.309
4.89%
jan 1, 2004
64.523
-6.461
-9.1%
jan 1, 2005
74.738
+10.215
15.83%
jan 1, 2006
64.551
-10.187
-13.63%
jan 1, 2007
62.626
-1.925
-2.98%
jan 1, 2008
73.772
+11.145
17.8%
jan 1, 2009
60.013
-13.759
-18.65%
jan 1, 2010
62.609
+2.596
4.33%
jan 1, 2011
70.015
+7.406
11.83%
jan 1, 2012
51.622
-18.392
-26.27%
jan 1, 2013
47.867
-3.755
-7.27%
jan 1, 2014
50.763
+2.895
6.05%
jan 1, 2015
52.496
+1.733
3.41%
jan 1, 2016
57.464
+4.968
9.46%
Ranking of countries by current statistics by years


Comments: