29
/
en
AIzaSyAYiBZKx7MnpbEhh9jyipgxe19OcubqV5w
April 1, 2024
258563
Syrian Arab Republic
SYR
true
2
1
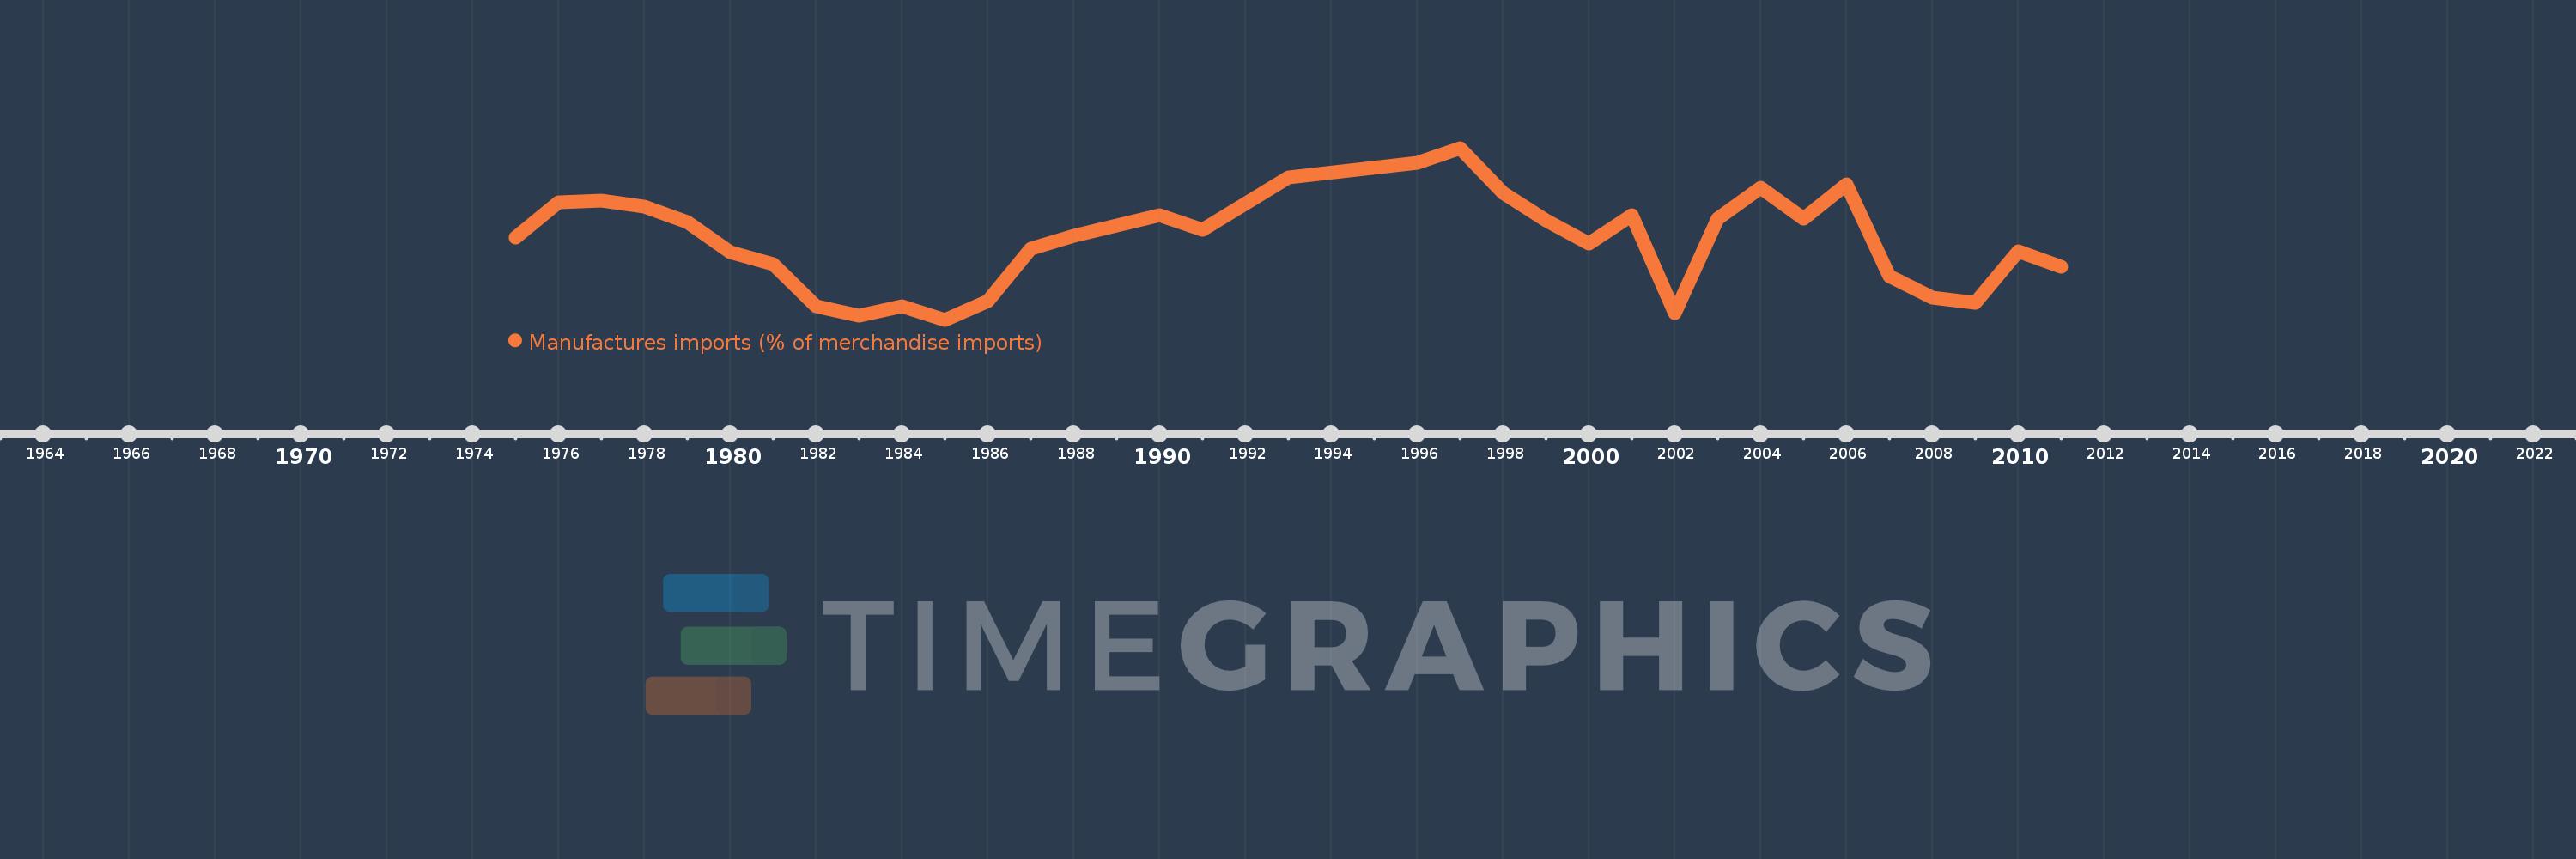
Manufactures imports (% of merchandise imports)
2011,2010,2009,2008,2007,2006,2005,2004,2003,2002,2001,2000,1999,1998,1997,1996,1993,1991,1990,1988,1987,1986,1985,1984,1983,1982,1981,1980,1979,1978,1977,1976,1975
This statistics in other country:
AfghanistanAlbaniaAlgeriaAndorraAngolaAntigua and BarbudaArab WorldArgentinaArmeniaArubaAustraliaAustriaAzerbaijanBahamas, TheBahrainBangladeshBarbadosBelarusBelgiumBelizeBeninBermudaBhutanBoliviaBosnia and HerzegovinaBotswanaBrazilBrunei DarussalamBulgariaBurkina FasoBurundiCabo VerdeCambodiaCameroonCanadaCaribbean small statesCayman IslandsCentral African RepublicCentral Europe and the BalticsChadChileChinaColombiaComorosCongo, Dem. Rep.Congo, Rep.Costa RicaCote d'IvoireCroatiaCubaCyprusCzech RepublicDenmarkDjiboutiDominicaDominican RepublicEarly-demographic dividendEast Asia & PacificEast Asia & Pacific (excluding high income)East Asia & Pacific (IDA & IBRD countries)EcuadorEgypt, Arab Rep.El SalvadorEquatorial GuineaEritreaEstoniaEthiopiaEuro areaEurope & Central AsiaEurope & Central Asia (excluding high income)Europe & Central Asia (IDA & IBRD countries)European UnionFaroe IslandsFijiFinlandFragile and conflict affected situationsFranceFrench PolynesiaGabonGambia, TheGeorgiaGermanyGhanaGreeceGreenlandGrenadaGuatemalaGuineaGuinea-BissauGuyanaHaitiHeavily indebted poor countries (HIPC)High incomeHondurasHong Kong SAR, ChinaHungaryIBRD onlyIcelandIDA & IBRD totalIDA blendIDA onlyIDA totalIndiaIndonesiaIran, Islamic Rep.IraqIrelandIsraelItalyJamaicaJapanJordanKazakhstanKenyaKiribatiKorea, Rep.KuwaitKyrgyz RepublicLao PDRLate-demographic dividendLatin America & Caribbean Latin America & Caribbean (excluding high income)Latin America & the Caribbean (IDA & IBRD countries)LatviaLeast developed countries: UN classificationLebanonLesothoLiberiaLibyaLithuaniaLow & middle incomeLow incomeLower middle incomeLuxembourgMacao SAR, ChinaMacedonia, FYRMadagascarMalawiMalaysiaMaldivesMaliMaltaMauritaniaMauritiusMexicoMiddle East & North AfricaMiddle East & North Africa (excluding high income)Middle East & North Africa (IDA & IBRD countries)Middle incomeMoldovaMongoliaMoroccoMozambiqueMyanmarNamibiaNepalNetherlandsNew CaledoniaNew ZealandNicaraguaNigerNigeriaNorth AmericaNorwayOECD membersOmanOther small statesPacific island small statesPakistanPalauPanamaPapua New GuineaParaguayPeruPhilippinesPolandPortugalPost-demographic dividendPre-demographic dividendQatarRomaniaRussian FederationRwandaSamoaSao Tome and PrincipeSaudi ArabiaSenegalSerbiaSeychellesSierra LeoneSingaporeSlovak RepublicSloveniaSmall statesSolomon IslandsSomaliaSouth AfricaSouth AsiaSouth Asia (IDA & IBRD)SpainSri LankaSt. Kitts and NevisSt. LuciaSt. Vincent and the GrenadinesSub-Saharan Africa Sub-Saharan Africa (excluding high income)Sub-Saharan Africa (IDA & IBRD countries)SudanSurinameSwazilandSwedenSwitzerlandSyrian Arab RepublicTajikistanTanzaniaThailandTimor-LesteTogoTongaTrinidad and TobagoTunisiaTurkeyTurkmenistanTurks and Caicos IslandsTuvaluUgandaUkraineUnited Arab EmiratesUnited KingdomUnited StatesUpper middle incomeUruguayVanuatuVenezuela, RBVietnamVirgin Islands (U.S.)WorldYemen, Rep.ZambiaZimbabwe Timeline:
This timeline shows a graph from 1975 to 2011 of Syrian Arab Republic. No data until 1974. Number of actual observations by date: 33.
Source name:
World Development Indicators
Source organization:
World Bank staff estimates from the Comtrade database maintained by the United Nations Statistics Division.
Categories, topics:
Private Sector, Trade
Last updated:
apr 23, 2017
Indicators value changes by year
Minimum:
42.947
jan 1, 1985
Maximum:
78.743
jan 1, 1997
At the date of observation
Value
Absolute change
Change from previous value
jan 1, 1975
60.055
+60.055
0.0%
jan 1, 1976
67.363
+7.309
12.17%
jan 1, 1977
67.828
+0.464
0.69%
jan 1, 1978
66.44
-1.388
-2.05%
jan 1, 1979
63.324
-3.116
-4.69%
jan 1, 1980
57.112
-6.212
-9.81%
jan 1, 1981
54.556
-2.556
-4.48%
jan 1, 1982
45.839
-8.717
-15.98%
jan 1, 1983
43.834
-2.004
-4.37%
jan 1, 1984
45.724
+1.89
4.31%
jan 1, 1985
42.947
-2.777
-6.07%
jan 1, 1986
46.883
+3.936
9.17%
jan 1, 1987
57.822
+10.938
23.33%
jan 1, 1988
60.39
+2.568
4.44%
jan 1, 1990
64.737
+4.348
7.2%
jan 1, 1991
61.646
-3.091
-4.78%
jan 1, 1993
72.54
+10.894
17.67%
jan 1, 1996
75.596
+3.056
4.21%
jan 1, 1997
78.743
+3.147
4.16%
jan 1, 1998
69.385
-9.359
-11.88%
jan 1, 1999
63.683
-5.702
-8.22%
jan 1, 2000
58.784
-4.899
-7.69%
jan 1, 2001
64.733
+5.95
10.12%
jan 1, 2002
44.268
-20.465
-31.61%
jan 1, 2003
63.97
+19.702
44.51%
jan 1, 2004
70.497
+6.527
10.2%
jan 1, 2005
63.952
-6.544
-9.28%
jan 1, 2006
71.233
+7.28
11.38%
jan 1, 2007
52.072
-19.161
-26.9%
jan 1, 2008
47.569
-4.502
-8.65%
jan 1, 2009
46.562
-1.007
-2.12%
jan 1, 2010
57.15
+10.587
22.74%
jan 1, 2011
54.051
-3.098
-5.42%
Ranking of countries by current statistics by years


Comments: