29
/
en
AIzaSyAYiBZKx7MnpbEhh9jyipgxe19OcubqV5w
April 1, 2024
40877
Late-demographic dividend
LTE
false
2
1
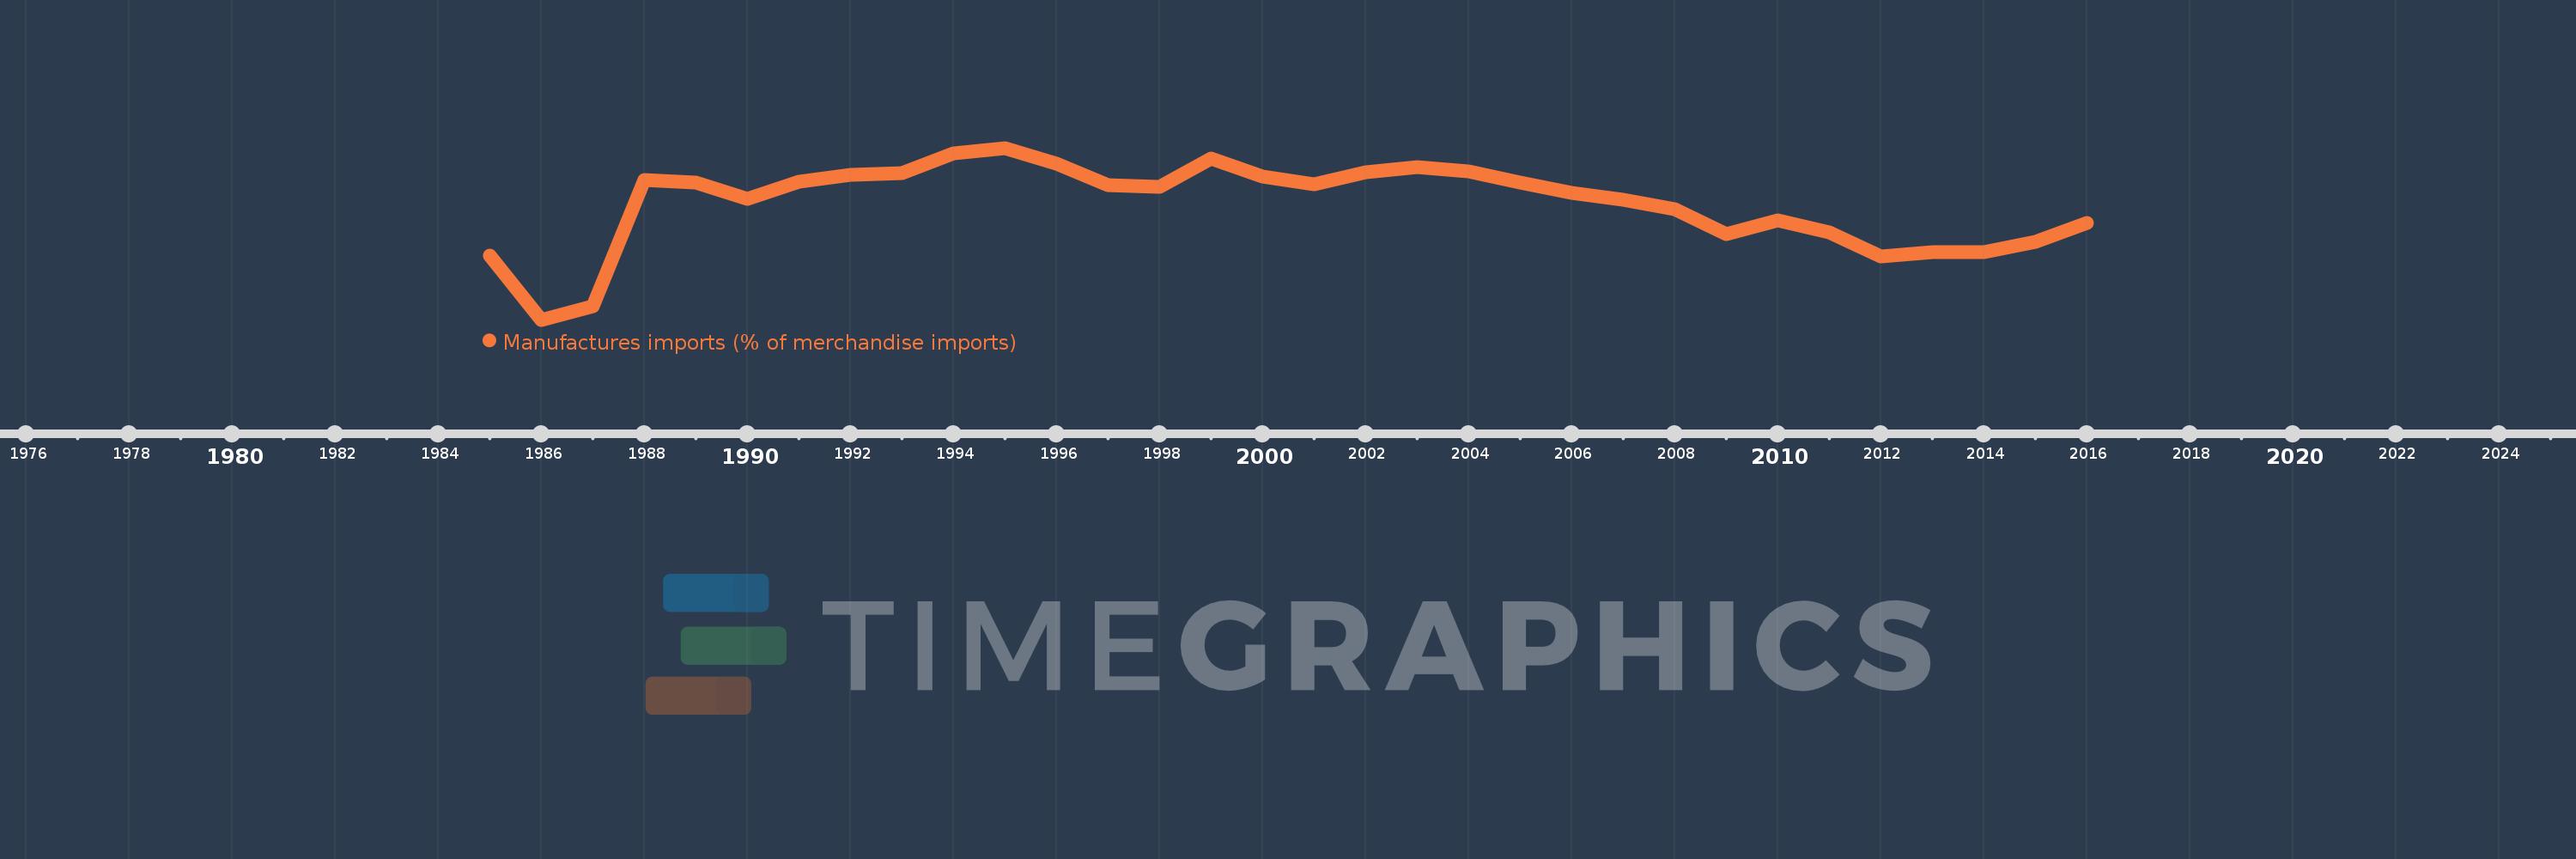
Manufactures imports (% of merchandise imports)
2016,2015,2014,2013,2012,2011,2010,2009,2008,2007,2006,2005,2004,2003,2002,2001,2000,1999,1998,1997,1996,1995,1994,1993,1992,1991,1990,1989,1988,1987,1986,1985
This statistics in other country:
AfghanistanAlbaniaAlgeriaAndorraAngolaAntigua and BarbudaArab WorldArgentinaArmeniaArubaAustraliaAustriaAzerbaijanBahamas, TheBahrainBangladeshBarbadosBelarusBelgiumBelizeBeninBermudaBhutanBoliviaBosnia and HerzegovinaBotswanaBrazilBrunei DarussalamBulgariaBurkina FasoBurundiCabo VerdeCambodiaCameroonCanadaCaribbean small statesCayman IslandsCentral African RepublicCentral Europe and the BalticsChadChileChinaColombiaComorosCongo, Dem. Rep.Congo, Rep.Costa RicaCote d'IvoireCroatiaCubaCyprusCzech RepublicDenmarkDjiboutiDominicaDominican RepublicEarly-demographic dividendEast Asia & PacificEast Asia & Pacific (excluding high income)East Asia & Pacific (IDA & IBRD countries)EcuadorEgypt, Arab Rep.El SalvadorEquatorial GuineaEritreaEstoniaEthiopiaEuro areaEurope & Central AsiaEurope & Central Asia (excluding high income)Europe & Central Asia (IDA & IBRD countries)European UnionFaroe IslandsFijiFinlandFragile and conflict affected situationsFranceFrench PolynesiaGabonGambia, TheGeorgiaGermanyGhanaGreeceGreenlandGrenadaGuatemalaGuineaGuinea-BissauGuyanaHaitiHeavily indebted poor countries (HIPC)High incomeHondurasHong Kong SAR, ChinaHungaryIBRD onlyIcelandIDA & IBRD totalIDA blendIDA onlyIDA totalIndiaIndonesiaIran, Islamic Rep.IraqIrelandIsraelItalyJamaicaJapanJordanKazakhstanKenyaKiribatiKorea, Rep.KuwaitKyrgyz RepublicLao PDRLate-demographic dividendLatin America & Caribbean Latin America & Caribbean (excluding high income)Latin America & the Caribbean (IDA & IBRD countries)LatviaLeast developed countries: UN classificationLebanonLesothoLiberiaLibyaLithuaniaLow & middle incomeLow incomeLower middle incomeLuxembourgMacao SAR, ChinaMacedonia, FYRMadagascarMalawiMalaysiaMaldivesMaliMaltaMauritaniaMauritiusMexicoMiddle East & North AfricaMiddle East & North Africa (excluding high income)Middle East & North Africa (IDA & IBRD countries)Middle incomeMoldovaMongoliaMoroccoMozambiqueMyanmarNamibiaNepalNetherlandsNew CaledoniaNew ZealandNicaraguaNigerNigeriaNorth AmericaNorwayOECD membersOmanOther small statesPacific island small statesPakistanPalauPanamaPapua New GuineaParaguayPeruPhilippinesPolandPortugalPost-demographic dividendPre-demographic dividendQatarRomaniaRussian FederationRwandaSamoaSao Tome and PrincipeSaudi ArabiaSenegalSerbiaSeychellesSierra LeoneSingaporeSlovak RepublicSloveniaSmall statesSolomon IslandsSomaliaSouth AfricaSouth AsiaSouth Asia (IDA & IBRD)SpainSri LankaSt. Kitts and NevisSt. LuciaSt. Vincent and the GrenadinesSub-Saharan Africa Sub-Saharan Africa (excluding high income)Sub-Saharan Africa (IDA & IBRD countries)SudanSurinameSwazilandSwedenSwitzerlandSyrian Arab RepublicTajikistanTanzaniaThailandTimor-LesteTogoTongaTrinidad and TobagoTunisiaTurkeyTurkmenistanTurks and Caicos IslandsTuvaluUgandaUkraineUnited Arab EmiratesUnited KingdomUnited StatesUpper middle incomeUruguayVanuatuVenezuela, RBVietnamVirgin Islands (U.S.)WorldYemen, Rep.ZambiaZimbabwe Timeline:
This timeline shows a graph from 1985 to 2016 of Late-demographic dividend. No data until 1984. Number of actual observations by date: 32.
Source name:
World Development Indicators
Source organization:
World Bank staff estimates from the Comtrade database maintained by the United Nations Statistics Division.
Categories, topics:
Private Sector, Trade
Last updated:
apr 23, 2017
Indicators value changes by year
Minimum:
54.796
jan 1, 1986
Maximum:
79.267
jan 1, 1995
At the date of observation
Value
Absolute change
Change from previous value
jan 1, 1985
63.896
+63.896
0.0%
jan 1, 1986
54.796
-9.1
-14.24%
jan 1, 1987
56.665
+1.869
3.41%
jan 1, 1988
74.707
+18.042
31.84%
jan 1, 1989
74.355
-0.352
-0.47%
jan 1, 1990
72.053
-2.303
-3.1%
jan 1, 1991
74.416
+2.363
3.28%
jan 1, 1992
75.412
+0.996
1.34%
jan 1, 1993
75.698
+0.286
0.38%
jan 1, 1994
78.509
+2.811
3.71%
jan 1, 1995
79.267
+0.758
0.96%
jan 1, 1996
77.03
-2.237
-2.82%
jan 1, 1997
73.927
-3.103
-4.03%
jan 1, 1998
73.76
-0.168
-0.23%
jan 1, 1999
77.788
+4.028
5.46%
jan 1, 2000
75.132
-2.656
-3.41%
jan 1, 2001
74.119
-1.014
-1.35%
jan 1, 2002
75.767
+1.649
2.22%
jan 1, 2003
76.495
+0.728
0.96%
jan 1, 2004
75.963
-0.532
-0.7%
jan 1, 2005
74.326
-1.637
-2.15%
jan 1, 2006
72.882
-1.444
-1.94%
jan 1, 2007
71.902
-0.98
-1.34%
jan 1, 2008
70.575
-1.327
-1.85%
jan 1, 2009
67.016
-3.559
-5.04%
jan 1, 2010
68.952
+1.936
2.89%
jan 1, 2011
67.291
-1.661
-2.41%
jan 1, 2012
63.779
-3.512
-5.22%
jan 1, 2013
64.466
+0.687
1.08%
jan 1, 2014
64.415
-0.051
-0.08%
jan 1, 2015
65.85
+1.435
2.23%
jan 1, 2016
68.621
+2.771
4.21%
Ranking of countries by current statistics by years


Comments: