29
/
en
AIzaSyAYiBZKx7MnpbEhh9jyipgxe19OcubqV5w
April 1, 2024
195823
Mexico
MEX
true
2
1
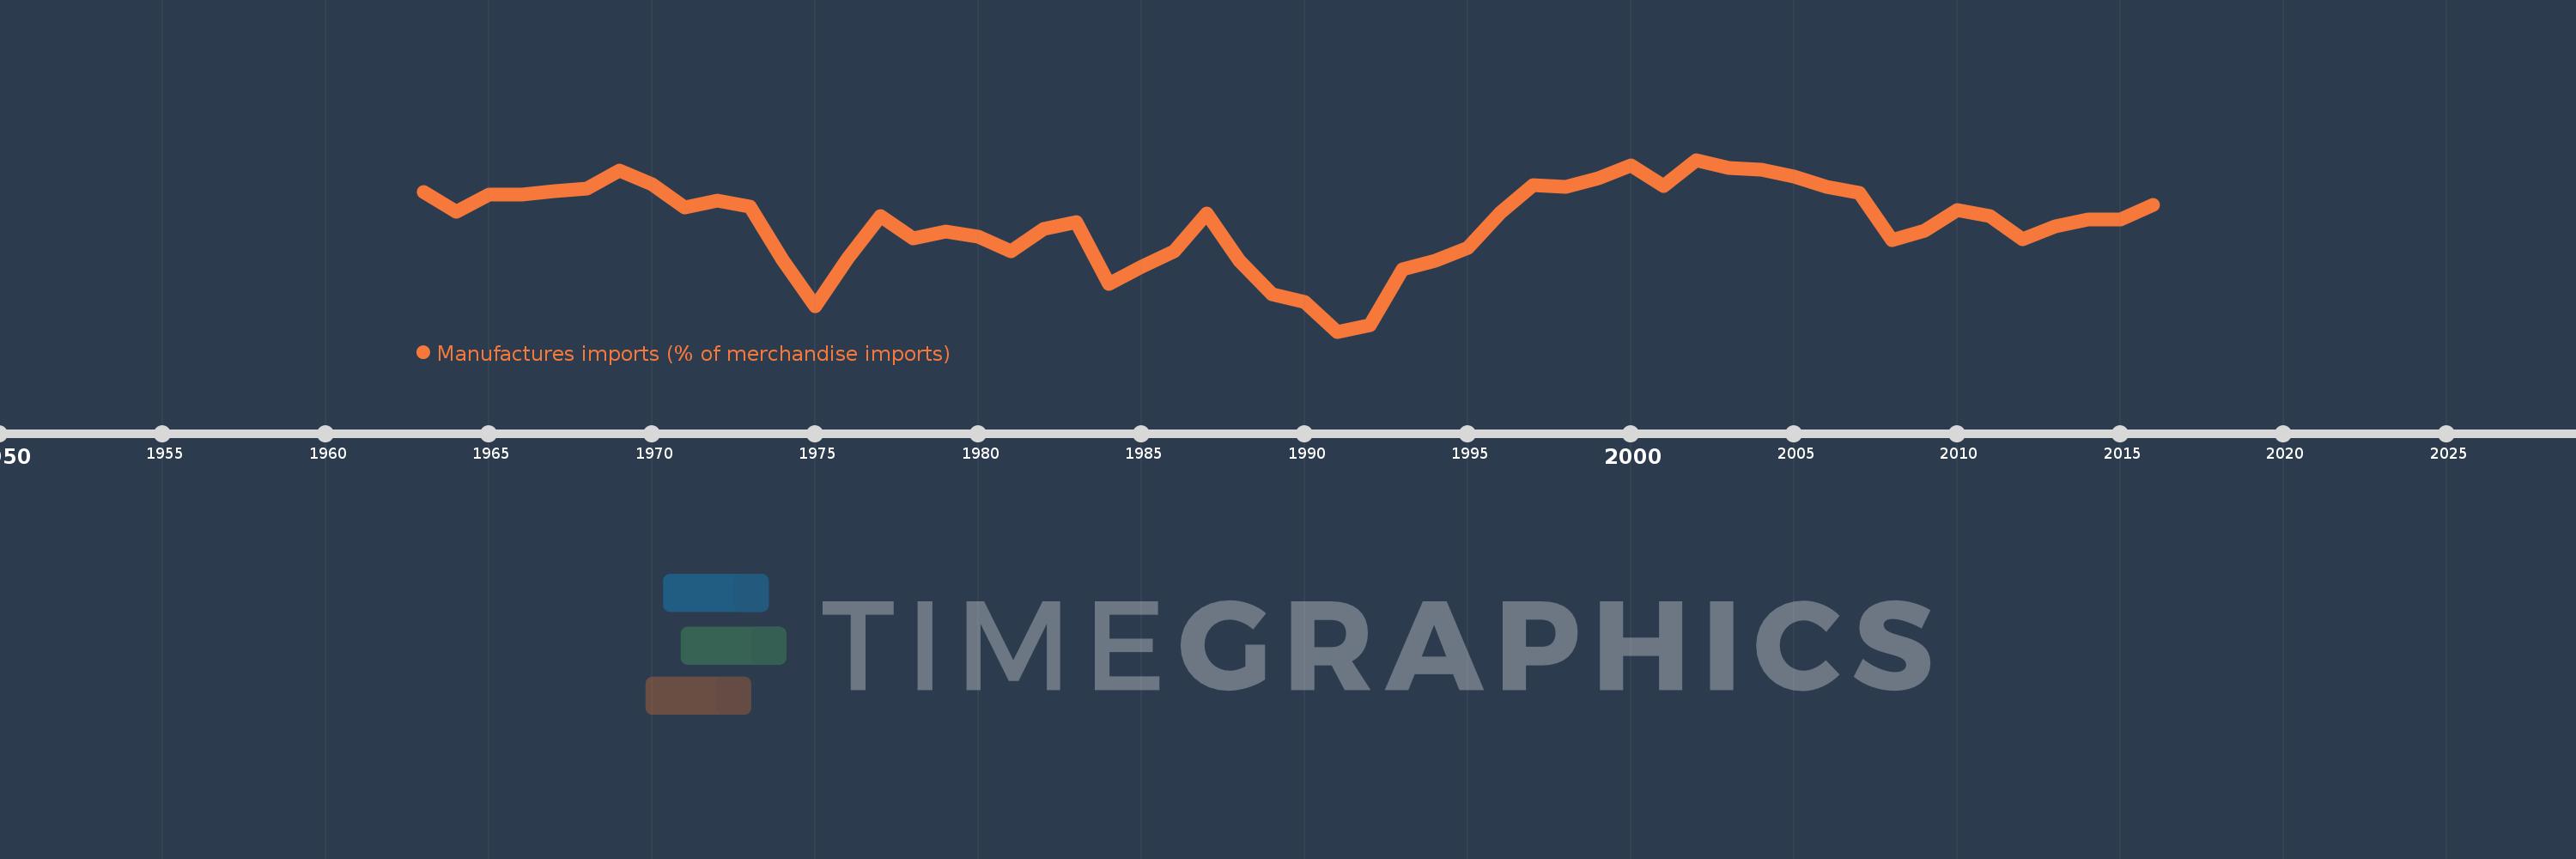
Manufactures imports (% of merchandise imports)
2016,2015,2014,2013,2012,2011,2010,2009,2008,2007,2006,2005,2004,2003,2002,2001,2000,1999,1998,1997,1996,1995,1994,1993,1992,1991,1990,1989,1988,1987,1986,1985,1984,1983,1982,1981,1980,1979,1978,1977,1976,1975,1974,1973,1972,1971,1970,1969,1968,1967,1966,1965,1964,1963
This statistics in other country:
AfghanistanAlbaniaAlgeriaAndorraAngolaAntigua and BarbudaArab WorldArgentinaArmeniaArubaAustraliaAustriaAzerbaijanBahamas, TheBahrainBangladeshBarbadosBelarusBelgiumBelizeBeninBermudaBhutanBoliviaBosnia and HerzegovinaBotswanaBrazilBrunei DarussalamBulgariaBurkina FasoBurundiCabo VerdeCambodiaCameroonCanadaCaribbean small statesCayman IslandsCentral African RepublicCentral Europe and the BalticsChadChileChinaColombiaComorosCongo, Dem. Rep.Congo, Rep.Costa RicaCote d'IvoireCroatiaCubaCyprusCzech RepublicDenmarkDjiboutiDominicaDominican RepublicEarly-demographic dividendEast Asia & PacificEast Asia & Pacific (excluding high income)East Asia & Pacific (IDA & IBRD countries)EcuadorEgypt, Arab Rep.El SalvadorEquatorial GuineaEritreaEstoniaEthiopiaEuro areaEurope & Central AsiaEurope & Central Asia (excluding high income)Europe & Central Asia (IDA & IBRD countries)European UnionFaroe IslandsFijiFinlandFragile and conflict affected situationsFranceFrench PolynesiaGabonGambia, TheGeorgiaGermanyGhanaGreeceGreenlandGrenadaGuatemalaGuineaGuinea-BissauGuyanaHaitiHeavily indebted poor countries (HIPC)High incomeHondurasHong Kong SAR, ChinaHungaryIBRD onlyIcelandIDA & IBRD totalIDA blendIDA onlyIDA totalIndiaIndonesiaIran, Islamic Rep.IraqIrelandIsraelItalyJamaicaJapanJordanKazakhstanKenyaKiribatiKorea, Rep.KuwaitKyrgyz RepublicLao PDRLate-demographic dividendLatin America & Caribbean Latin America & Caribbean (excluding high income)Latin America & the Caribbean (IDA & IBRD countries)LatviaLeast developed countries: UN classificationLebanonLesothoLiberiaLibyaLithuaniaLow & middle incomeLow incomeLower middle incomeLuxembourgMacao SAR, ChinaMacedonia, FYRMadagascarMalawiMalaysiaMaldivesMaliMaltaMauritaniaMauritiusMexicoMiddle East & North AfricaMiddle East & North Africa (excluding high income)Middle East & North Africa (IDA & IBRD countries)Middle incomeMoldovaMongoliaMoroccoMozambiqueMyanmarNamibiaNepalNetherlandsNew CaledoniaNew ZealandNicaraguaNigerNigeriaNorth AmericaNorwayOECD membersOmanOther small statesPacific island small statesPakistanPalauPanamaPapua New GuineaParaguayPeruPhilippinesPolandPortugalPost-demographic dividendPre-demographic dividendQatarRomaniaRussian FederationRwandaSamoaSao Tome and PrincipeSaudi ArabiaSenegalSerbiaSeychellesSierra LeoneSingaporeSlovak RepublicSloveniaSmall statesSolomon IslandsSomaliaSouth AfricaSouth AsiaSouth Asia (IDA & IBRD)SpainSri LankaSt. Kitts and NevisSt. LuciaSt. Vincent and the GrenadinesSub-Saharan Africa Sub-Saharan Africa (excluding high income)Sub-Saharan Africa (IDA & IBRD countries)SudanSurinameSwazilandSwedenSwitzerlandSyrian Arab RepublicTajikistanTanzaniaThailandTimor-LesteTogoTongaTrinidad and TobagoTunisiaTurkeyTurkmenistanTurks and Caicos IslandsTuvaluUgandaUkraineUnited Arab EmiratesUnited KingdomUnited StatesUpper middle incomeUruguayVanuatuVenezuela, RBVietnamVirgin Islands (U.S.)WorldYemen, Rep.ZambiaZimbabwe Timeline:
This timeline shows a graph from 1963 to 2016 of Mexico. No data until 1962. Number of actual observations by date: 54.
Source name:
World Development Indicators
Source organization:
World Bank staff estimates from the Comtrade database maintained by the United Nations Statistics Division.
Categories, topics:
Private Sector, Trade
Last updated:
apr 23, 2017
Indicators value changes by year
Minimum:
64.208
jan 1, 1991
Maximum:
87.005
jan 1, 2002
At the date of observation
Value
Absolute change
Change from previous value
jan 1, 1963
82.778
+82.778
0.0%
jan 1, 1964
80.107
-2.67
-3.23%
jan 1, 1965
82.351
+2.243
2.8%
jan 1, 1966
82.444
+0.094
0.11%
jan 1, 1967
82.838
+0.394
0.48%
jan 1, 1968
83.2
+0.361
0.44%
jan 1, 1969
85.552
+2.353
2.83%
jan 1, 1970
83.81
-1.743
-2.04%
jan 1, 1971
80.649
-3.161
-3.77%
jan 1, 1972
81.574
+0.925
1.15%
jan 1, 1973
80.753
-0.82
-1.01%
jan 1, 1974
73.75
-7.003
-8.67%
jan 1, 1975
67.604
-6.146
-8.33%
jan 1, 1976
74.001
+6.397
9.46%
jan 1, 1977
79.58
+5.579
7.54%
jan 1, 1978
76.54
-3.04
-3.82%
jan 1, 1979
77.454
+0.914
1.19%
jan 1, 1980
76.839
-0.615
-0.79%
jan 1, 1981
74.869
-1.97
-2.56%
jan 1, 1982
77.87
+3.002
4.01%
jan 1, 1983
78.756
+0.885
1.14%
jan 1, 1984
70.481
-8.274
-10.51%
jan 1, 1985
72.805
+2.324
3.3%
jan 1, 1986
74.844
+2.039
2.8%
jan 1, 1987
79.926
+5.082
6.79%
jan 1, 1988
73.664
-6.261
-7.83%
jan 1, 1989
69.203
-4.462
-6.06%
jan 1, 1990
68.091
-1.112
-1.61%
jan 1, 1991
64.208
-3.883
-5.7%
jan 1, 1992
65.07
+0.862
1.34%
jan 1, 1993
72.447
+7.377
11.34%
jan 1, 1994
73.646
+1.199
1.65%
jan 1, 1995
75.265
+1.619
2.2%
jan 1, 1996
80.004
+4.739
6.3%
jan 1, 1997
83.6
+3.596
4.49%
jan 1, 1998
83.406
-0.194
-0.23%
jan 1, 1999
84.524
+1.118
1.34%
jan 1, 2000
86.222
+1.698
2.01%
jan 1, 2001
83.477
-2.745
-3.18%
jan 1, 2002
87.005
+3.528
4.23%
jan 1, 2003
85.89
-1.115
-1.28%
jan 1, 2004
85.727
-0.162
-0.19%
jan 1, 2005
84.749
-0.978
-1.14%
jan 1, 2006
83.404
-1.345
-1.59%
jan 1, 2007
82.609
-0.795
-0.95%
jan 1, 2008
76.35
-6.259
-7.58%
jan 1, 2009
77.593
+1.243
1.63%
jan 1, 2010
80.392
+2.8
3.61%
jan 1, 2011
79.51
-0.882
-1.1%
jan 1, 2012
76.502
-3.008
-3.78%
jan 1, 2013
78.211
+1.709
2.23%
jan 1, 2014
79.136
+0.925
1.18%
jan 1, 2015
79.125
-0.011
-0.01%
jan 1, 2016
80.995
+1.87
2.36%
Ranking of countries by current statistics by years


Comments: