29
/
en
AIzaSyAYiBZKx7MnpbEhh9jyipgxe19OcubqV5w
April 1, 2024
125060
Egypt, Arab Rep.
EGY
true
2
1
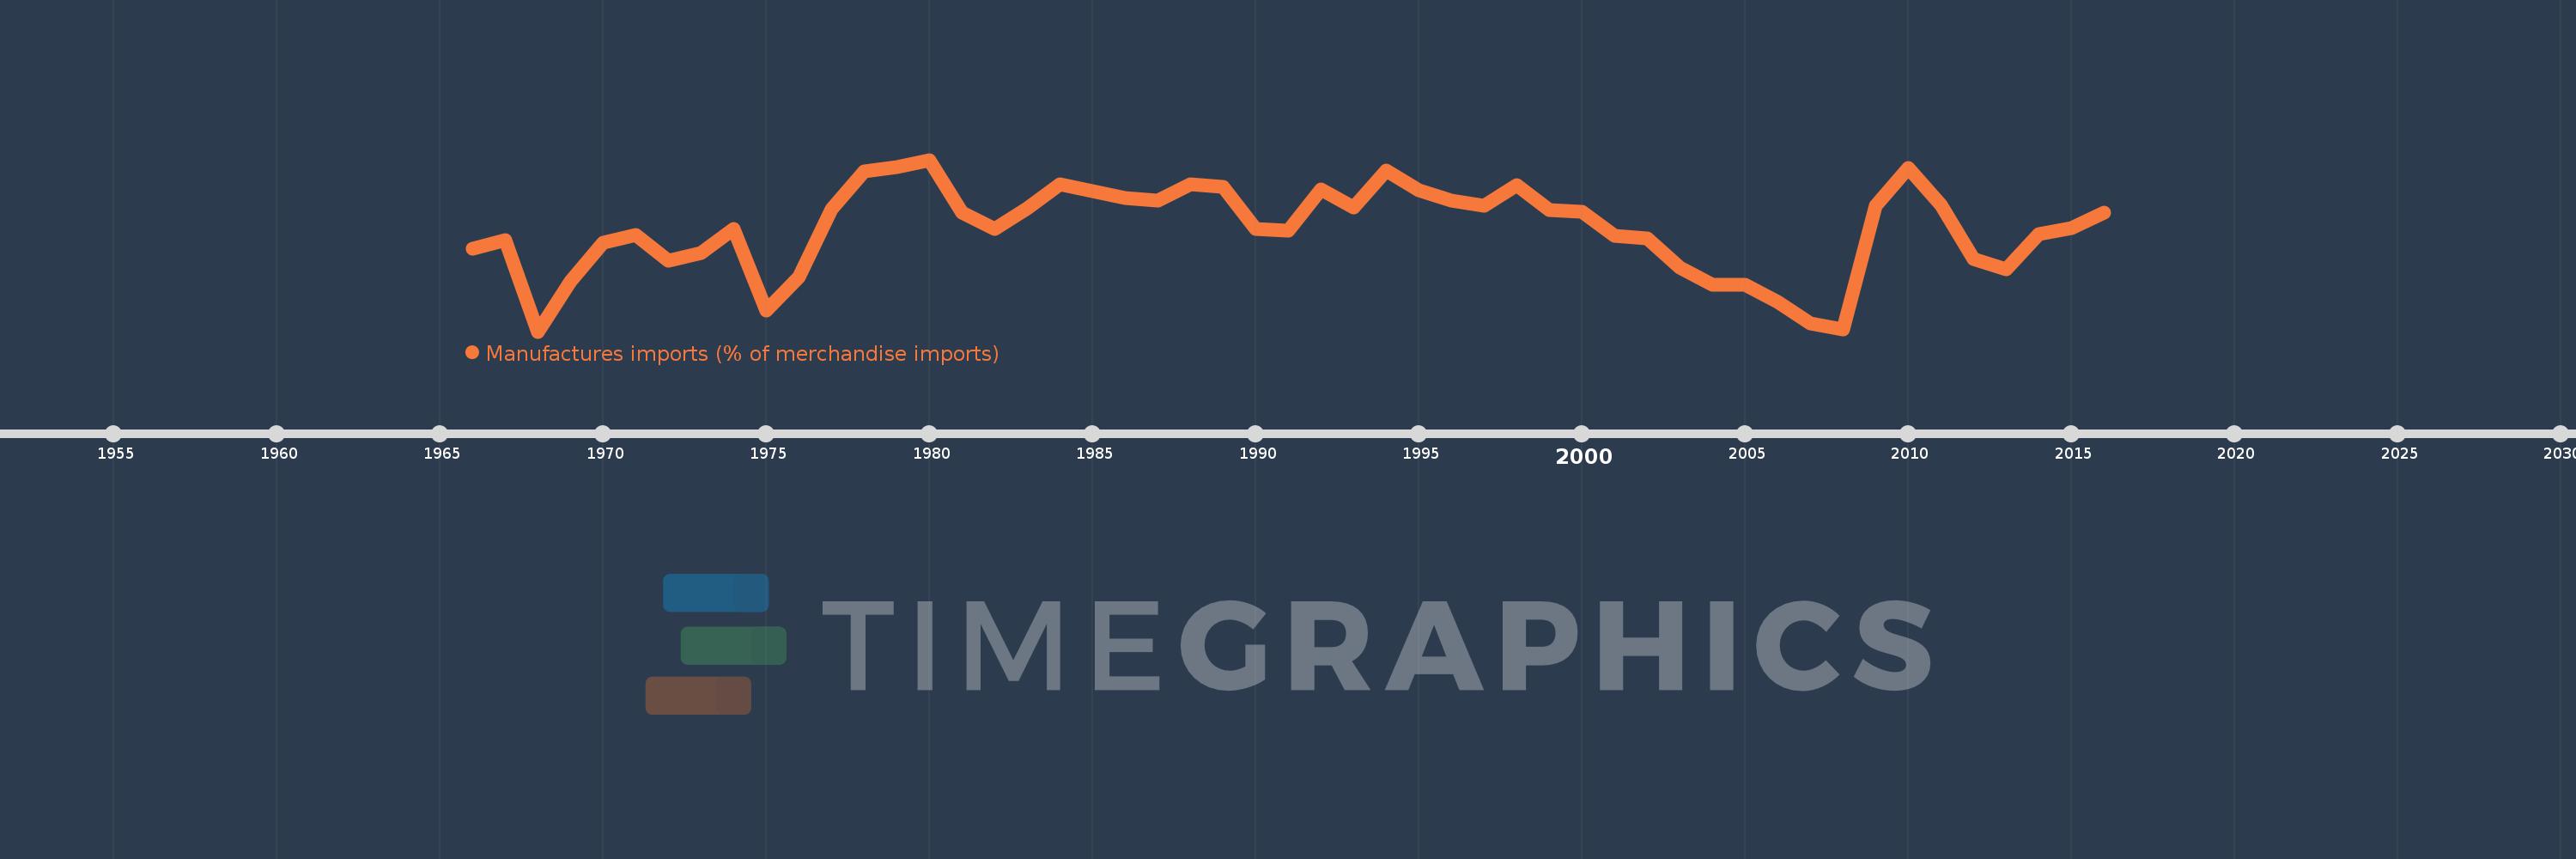
Manufactures imports (% of merchandise imports)
2016,2015,2014,2013,2012,2011,2010,2009,2008,2007,2006,2005,2004,2003,2002,2001,2000,1999,1998,1997,1996,1995,1994,1993,1992,1991,1990,1989,1988,1987,1986,1985,1984,1983,1982,1981,1980,1979,1978,1977,1976,1975,1974,1973,1972,1971,1970,1969,1968,1967,1966
This statistics in other country:
AfghanistanAlbaniaAlgeriaAndorraAngolaAntigua and BarbudaArab WorldArgentinaArmeniaArubaAustraliaAustriaAzerbaijanBahamas, TheBahrainBangladeshBarbadosBelarusBelgiumBelizeBeninBermudaBhutanBoliviaBosnia and HerzegovinaBotswanaBrazilBrunei DarussalamBulgariaBurkina FasoBurundiCabo VerdeCambodiaCameroonCanadaCaribbean small statesCayman IslandsCentral African RepublicCentral Europe and the BalticsChadChileChinaColombiaComorosCongo, Dem. Rep.Congo, Rep.Costa RicaCote d'IvoireCroatiaCubaCyprusCzech RepublicDenmarkDjiboutiDominicaDominican RepublicEarly-demographic dividendEast Asia & PacificEast Asia & Pacific (excluding high income)East Asia & Pacific (IDA & IBRD countries)EcuadorEgypt, Arab Rep.El SalvadorEquatorial GuineaEritreaEstoniaEthiopiaEuro areaEurope & Central AsiaEurope & Central Asia (excluding high income)Europe & Central Asia (IDA & IBRD countries)European UnionFaroe IslandsFijiFinlandFragile and conflict affected situationsFranceFrench PolynesiaGabonGambia, TheGeorgiaGermanyGhanaGreeceGreenlandGrenadaGuatemalaGuineaGuinea-BissauGuyanaHaitiHeavily indebted poor countries (HIPC)High incomeHondurasHong Kong SAR, ChinaHungaryIBRD onlyIcelandIDA & IBRD totalIDA blendIDA onlyIDA totalIndiaIndonesiaIran, Islamic Rep.IraqIrelandIsraelItalyJamaicaJapanJordanKazakhstanKenyaKiribatiKorea, Rep.KuwaitKyrgyz RepublicLao PDRLate-demographic dividendLatin America & Caribbean Latin America & Caribbean (excluding high income)Latin America & the Caribbean (IDA & IBRD countries)LatviaLeast developed countries: UN classificationLebanonLesothoLiberiaLibyaLithuaniaLow & middle incomeLow incomeLower middle incomeLuxembourgMacao SAR, ChinaMacedonia, FYRMadagascarMalawiMalaysiaMaldivesMaliMaltaMauritaniaMauritiusMexicoMiddle East & North AfricaMiddle East & North Africa (excluding high income)Middle East & North Africa (IDA & IBRD countries)Middle incomeMoldovaMongoliaMoroccoMozambiqueMyanmarNamibiaNepalNetherlandsNew CaledoniaNew ZealandNicaraguaNigerNigeriaNorth AmericaNorwayOECD membersOmanOther small statesPacific island small statesPakistanPalauPanamaPapua New GuineaParaguayPeruPhilippinesPolandPortugalPost-demographic dividendPre-demographic dividendQatarRomaniaRussian FederationRwandaSamoaSao Tome and PrincipeSaudi ArabiaSenegalSerbiaSeychellesSierra LeoneSingaporeSlovak RepublicSloveniaSmall statesSolomon IslandsSomaliaSouth AfricaSouth AsiaSouth Asia (IDA & IBRD)SpainSri LankaSt. Kitts and NevisSt. LuciaSt. Vincent and the GrenadinesSub-Saharan Africa Sub-Saharan Africa (excluding high income)Sub-Saharan Africa (IDA & IBRD countries)SudanSurinameSwazilandSwedenSwitzerlandSyrian Arab RepublicTajikistanTanzaniaThailandTimor-LesteTogoTongaTrinidad and TobagoTunisiaTurkeyTurkmenistanTurks and Caicos IslandsTuvaluUgandaUkraineUnited Arab EmiratesUnited KingdomUnited StatesUpper middle incomeUruguayVanuatuVenezuela, RBVietnamVirgin Islands (U.S.)WorldYemen, Rep.ZambiaZimbabwe Timeline:
This timeline shows a graph from 1966 to 2016 of Egypt, Arab Rep.. No data until 1965. Number of actual observations by date: 51.
Source name:
World Development Indicators
Source organization:
World Bank staff estimates from the Comtrade database maintained by the United Nations Statistics Division.
Categories, topics:
Private Sector, Trade
Last updated:
apr 23, 2017
Indicators value changes by year
Minimum:
42.093
jan 1, 1968
Maximum:
66.396
jan 1, 1980
At the date of observation
Value
Absolute change
Change from previous value
jan 1, 1966
53.846
+53.846
0.0%
jan 1, 1967
55.07
+1.223
2.27%
jan 1, 1968
42.093
-12.976
-23.56%
jan 1, 1969
49.181
+7.087
16.84%
jan 1, 1970
54.684
+5.503
11.19%
jan 1, 1971
55.78
+1.096
2.0%
jan 1, 1972
52.089
-3.691
-6.62%
jan 1, 1973
53.202
+1.113
2.14%
jan 1, 1974
56.673
+3.471
6.52%
jan 1, 1975
45.112
-11.561
-20.4%
jan 1, 1976
49.761
+4.649
10.31%
jan 1, 1977
59.437
+9.676
19.45%
jan 1, 1978
64.736
+5.299
8.91%
jan 1, 1979
65.384
+0.648
1.0%
jan 1, 1980
66.396
+1.012
1.55%
jan 1, 1981
58.95
-7.446
-11.21%
jan 1, 1982
56.625
-2.325
-3.94%
jan 1, 1983
59.585
+2.96
5.23%
jan 1, 1984
62.943
+3.358
5.64%
jan 1, 1985
61.958
-0.985
-1.57%
jan 1, 1986
60.99
-0.968
-1.56%
jan 1, 1987
60.675
-0.315
-0.52%
jan 1, 1988
62.987
+2.312
3.81%
jan 1, 1989
62.602
-0.386
-0.61%
jan 1, 1990
56.643
-5.958
-9.52%
jan 1, 1991
56.313
-0.331
-0.58%
jan 1, 1992
62.156
+5.843
10.38%
jan 1, 1993
59.676
-2.481
-3.99%
jan 1, 1994
64.875
+5.2
8.71%
jan 1, 1995
62.141
-2.734
-4.21%
jan 1, 1996
60.608
-1.533
-2.47%
jan 1, 1997
59.881
-0.727
-1.2%
jan 1, 1998
62.829
+2.948
4.92%
jan 1, 1999
59.316
-3.513
-5.59%
jan 1, 2000
59.0
-0.316
-0.53%
jan 1, 2001
55.688
-3.312
-5.61%
jan 1, 2002
55.284
-0.404
-0.73%
jan 1, 2003
51.165
-4.119
-7.45%
jan 1, 2004
48.73
-2.435
-4.76%
jan 1, 2005
48.662
-0.068
-0.14%
jan 1, 2006
46.245
-2.417
-4.97%
jan 1, 2007
43.222
-3.023
-6.54%
jan 1, 2008
42.363
-0.859
-1.99%
jan 1, 2009
59.882
+17.519
41.35%
jan 1, 2010
65.242
+5.36
8.95%
jan 1, 2011
60.05
-5.191
-7.96%
jan 1, 2012
52.35
-7.7
-12.82%
jan 1, 2013
50.946
-1.404
-2.68%
jan 1, 2014
55.904
+4.957
9.73%
jan 1, 2015
56.782
+0.878
1.57%
jan 1, 2016
58.905
+2.123
3.74%
Ranking of countries by current statistics by years


Comments: