29
/
en
AIzaSyAYiBZKx7MnpbEhh9jyipgxe19OcubqV5w
April 1, 2024
256570
Sweden
SWE
true
2
1
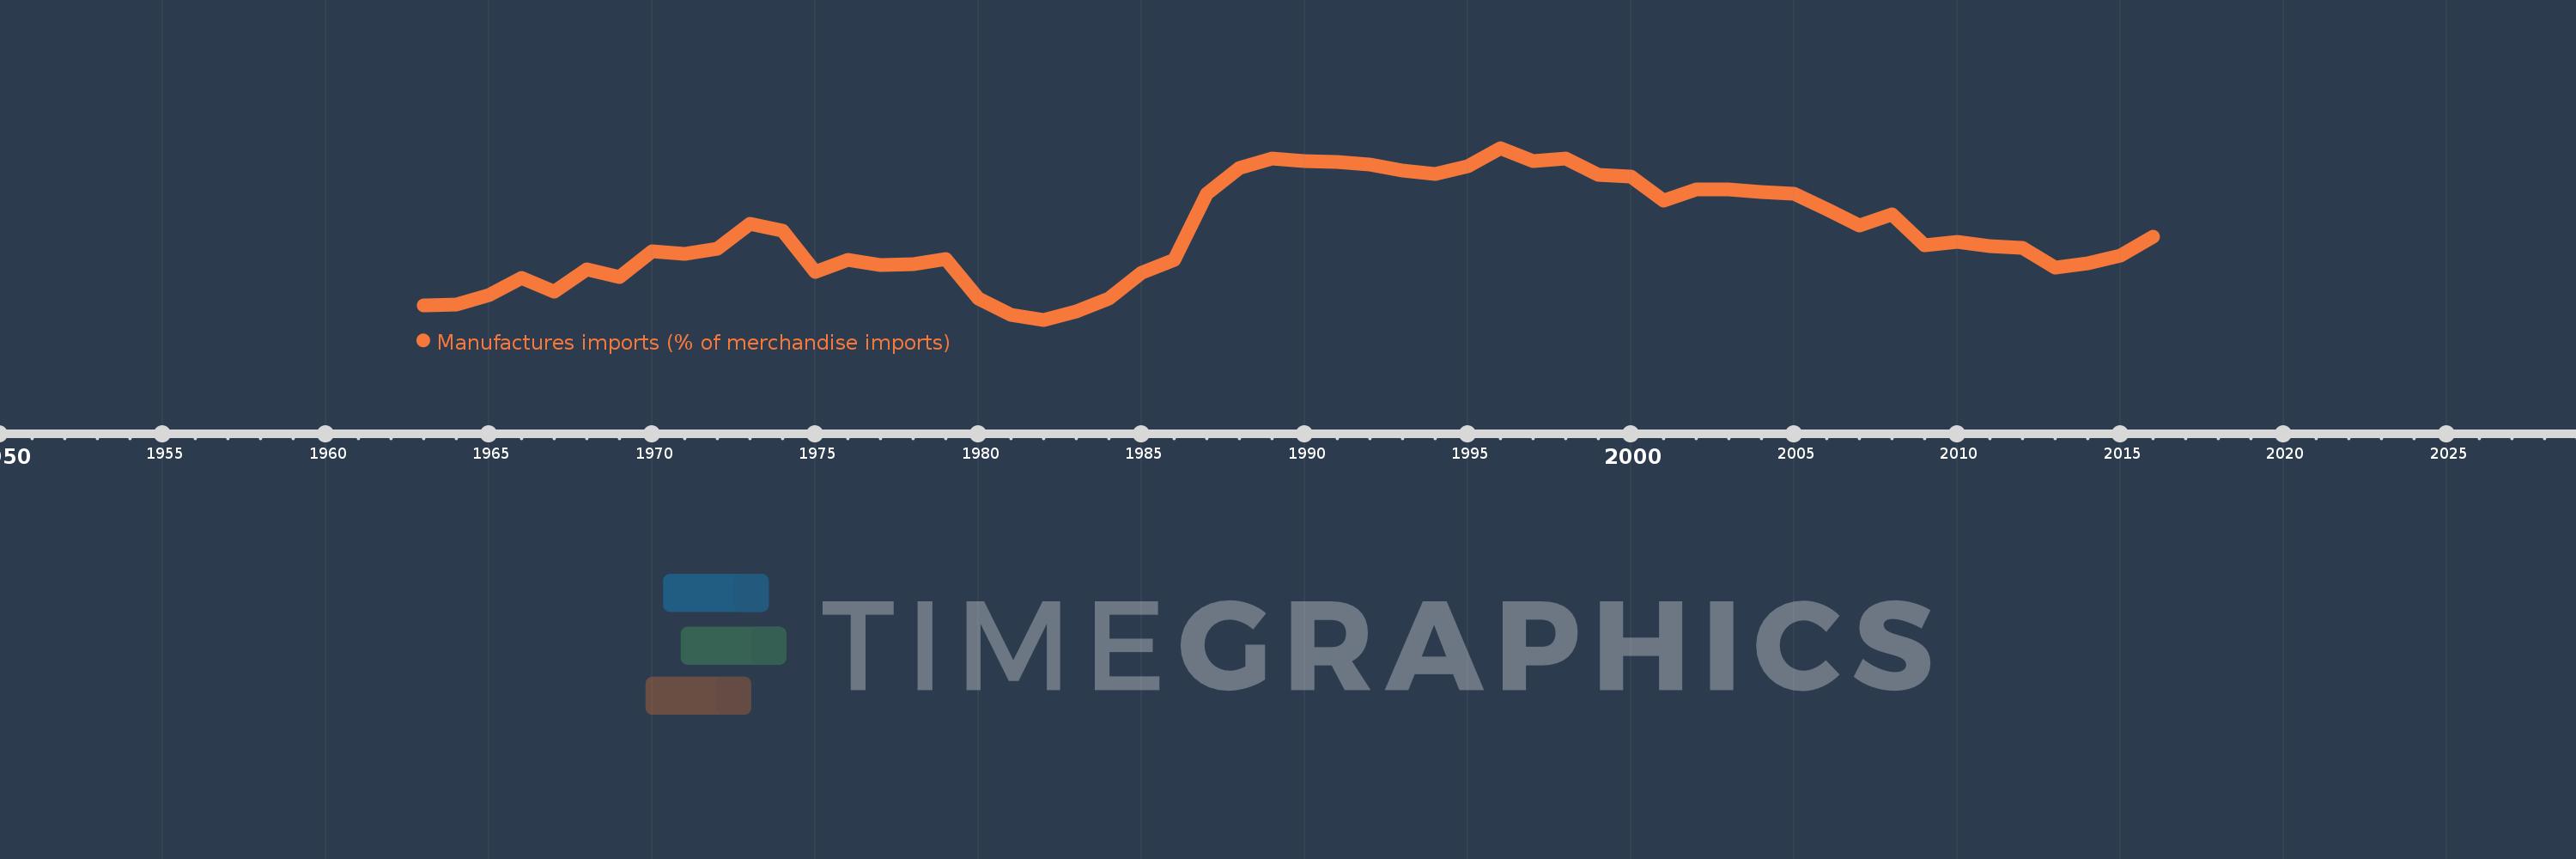
Manufactures imports (% of merchandise imports)
2016,2015,2014,2013,2012,2011,2010,2009,2008,2007,2006,2005,2004,2003,2002,2001,2000,1999,1998,1997,1996,1995,1994,1993,1992,1991,1990,1989,1988,1987,1986,1985,1984,1983,1982,1981,1980,1979,1978,1977,1976,1975,1974,1973,1972,1971,1970,1969,1968,1967,1966,1965,1964,1963
This statistics in other country:
AfghanistanAlbaniaAlgeriaAndorraAngolaAntigua and BarbudaArab WorldArgentinaArmeniaArubaAustraliaAustriaAzerbaijanBahamas, TheBahrainBangladeshBarbadosBelarusBelgiumBelizeBeninBermudaBhutanBoliviaBosnia and HerzegovinaBotswanaBrazilBrunei DarussalamBulgariaBurkina FasoBurundiCabo VerdeCambodiaCameroonCanadaCaribbean small statesCayman IslandsCentral African RepublicCentral Europe and the BalticsChadChileChinaColombiaComorosCongo, Dem. Rep.Congo, Rep.Costa RicaCote d'IvoireCroatiaCubaCyprusCzech RepublicDenmarkDjiboutiDominicaDominican RepublicEarly-demographic dividendEast Asia & PacificEast Asia & Pacific (excluding high income)East Asia & Pacific (IDA & IBRD countries)EcuadorEgypt, Arab Rep.El SalvadorEquatorial GuineaEritreaEstoniaEthiopiaEuro areaEurope & Central AsiaEurope & Central Asia (excluding high income)Europe & Central Asia (IDA & IBRD countries)European UnionFaroe IslandsFijiFinlandFragile and conflict affected situationsFranceFrench PolynesiaGabonGambia, TheGeorgiaGermanyGhanaGreeceGreenlandGrenadaGuatemalaGuineaGuinea-BissauGuyanaHaitiHeavily indebted poor countries (HIPC)High incomeHondurasHong Kong SAR, ChinaHungaryIBRD onlyIcelandIDA & IBRD totalIDA blendIDA onlyIDA totalIndiaIndonesiaIran, Islamic Rep.IraqIrelandIsraelItalyJamaicaJapanJordanKazakhstanKenyaKiribatiKorea, Rep.KuwaitKyrgyz RepublicLao PDRLate-demographic dividendLatin America & Caribbean Latin America & Caribbean (excluding high income)Latin America & the Caribbean (IDA & IBRD countries)LatviaLeast developed countries: UN classificationLebanonLesothoLiberiaLibyaLithuaniaLow & middle incomeLow incomeLower middle incomeLuxembourgMacao SAR, ChinaMacedonia, FYRMadagascarMalawiMalaysiaMaldivesMaliMaltaMauritaniaMauritiusMexicoMiddle East & North AfricaMiddle East & North Africa (excluding high income)Middle East & North Africa (IDA & IBRD countries)Middle incomeMoldovaMongoliaMoroccoMozambiqueMyanmarNamibiaNepalNetherlandsNew CaledoniaNew ZealandNicaraguaNigerNigeriaNorth AmericaNorwayOECD membersOmanOther small statesPacific island small statesPakistanPalauPanamaPapua New GuineaParaguayPeruPhilippinesPolandPortugalPost-demographic dividendPre-demographic dividendQatarRomaniaRussian FederationRwandaSamoaSao Tome and PrincipeSaudi ArabiaSenegalSerbiaSeychellesSierra LeoneSingaporeSlovak RepublicSloveniaSmall statesSolomon IslandsSomaliaSouth AfricaSouth AsiaSouth Asia (IDA & IBRD)SpainSri LankaSt. Kitts and NevisSt. LuciaSt. Vincent and the GrenadinesSub-Saharan Africa Sub-Saharan Africa (excluding high income)Sub-Saharan Africa (IDA & IBRD countries)SudanSurinameSwazilandSwedenSwitzerlandSyrian Arab RepublicTajikistanTanzaniaThailandTimor-LesteTogoTongaTrinidad and TobagoTunisiaTurkeyTurkmenistanTurks and Caicos IslandsTuvaluUgandaUkraineUnited Arab EmiratesUnited KingdomUnited StatesUpper middle incomeUruguayVanuatuVenezuela, RBVietnamVirgin Islands (U.S.)WorldYemen, Rep.ZambiaZimbabwe Timeline:
This timeline shows a graph from 1963 to 2016 of Sweden. No data until 1962. Number of actual observations by date: 54.
Source name:
World Development Indicators
Source organization:
World Bank staff estimates from the Comtrade database maintained by the United Nations Statistics Division.
Categories, topics:
Private Sector, Trade
Last updated:
apr 23, 2017
Indicators value changes by year
Minimum:
61.038
jan 1, 1982
At the date of observation
Value
Absolute change
Change from previous value
jan 1, 1963
62.599
+62.599
0.0%
jan 1, 1964
62.723
+0.124
0.2%
jan 1, 1965
63.817
+1.094
1.74%
jan 1, 1966
65.682
+1.865
2.92%
jan 1, 1967
64.193
-1.489
-2.27%
jan 1, 1968
66.607
+2.414
3.76%
jan 1, 1969
65.798
-0.809
-1.22%
jan 1, 1970
68.616
+2.818
4.28%
jan 1, 1971
68.342
-0.274
-0.4%
jan 1, 1972
68.922
+0.58
0.85%
jan 1, 1973
71.671
+2.75
3.99%
jan 1, 1974
70.938
-0.733
-1.02%
jan 1, 1975
66.403
-4.535
-6.39%
jan 1, 1976
67.704
+1.301
1.96%
jan 1, 1977
67.125
-0.578
-0.85%
jan 1, 1978
67.224
+0.098
0.15%
jan 1, 1979
67.819
+0.595
0.88%
jan 1, 1980
63.416
-4.402
-6.49%
jan 1, 1981
61.622
-1.794
-2.83%
jan 1, 1982
61.038
-0.584
-0.95%
jan 1, 1983
61.92
+0.882
1.45%
jan 1, 1984
63.358
+1.437
2.32%
jan 1, 1985
66.251
+2.894
4.57%
jan 1, 1986
67.734
+1.483
2.24%
jan 1, 1987
75.046
+7.312
10.8%
jan 1, 1988
77.889
+2.843
3.79%
jan 1, 1989
78.947
+1.058
1.36%
jan 1, 1990
78.72
-0.228
-0.29%
jan 1, 1991
78.649
-0.07
-0.09%
jan 1, 1992
78.283
-0.367
-0.47%
jan 1, 1993
77.651
-0.631
-0.81%
jan 1, 1994
77.246
-0.406
-0.52%
jan 1, 1995
78.111
+0.865
1.12%
jan 1, 1996
80.16
+2.049
2.62%
jan 1, 1997
78.739
-1.421
-1.77%
jan 1, 1998
78.948
+0.209
0.27%
jan 1, 1999
77.129
-1.819
-2.3%
jan 1, 2000
76.963
-0.167
-0.22%
jan 1, 2001
74.343
-2.62
-3.4%
jan 1, 2002
75.548
+1.205
1.62%
jan 1, 2003
75.531
-0.018
-0.02%
jan 1, 2004
75.296
-0.235
-0.31%
jan 1, 2005
75.107
-0.189
-0.25%
jan 1, 2006
73.323
-1.784
-2.38%
jan 1, 2007
71.511
-1.812
-2.47%
jan 1, 2008
72.776
+1.265
1.77%
jan 1, 2009
69.298
-3.478
-4.78%
jan 1, 2010
69.672
+0.374
0.54%
jan 1, 2011
69.253
-0.419
-0.6%
jan 1, 2012
69.0
-0.253
-0.36%
jan 1, 2013
66.841
-2.159
-3.13%
jan 1, 2014
67.312
+0.471
0.7%
jan 1, 2015
68.227
+0.914
1.36%
jan 1, 2016
70.313
+2.086
3.06%
Ranking of countries by current statistics by years


Comments: