29
/
en
AIzaSyAYiBZKx7MnpbEhh9jyipgxe19OcubqV5w
April 1, 2024
257536
Switzerland
CHE
true
2
1
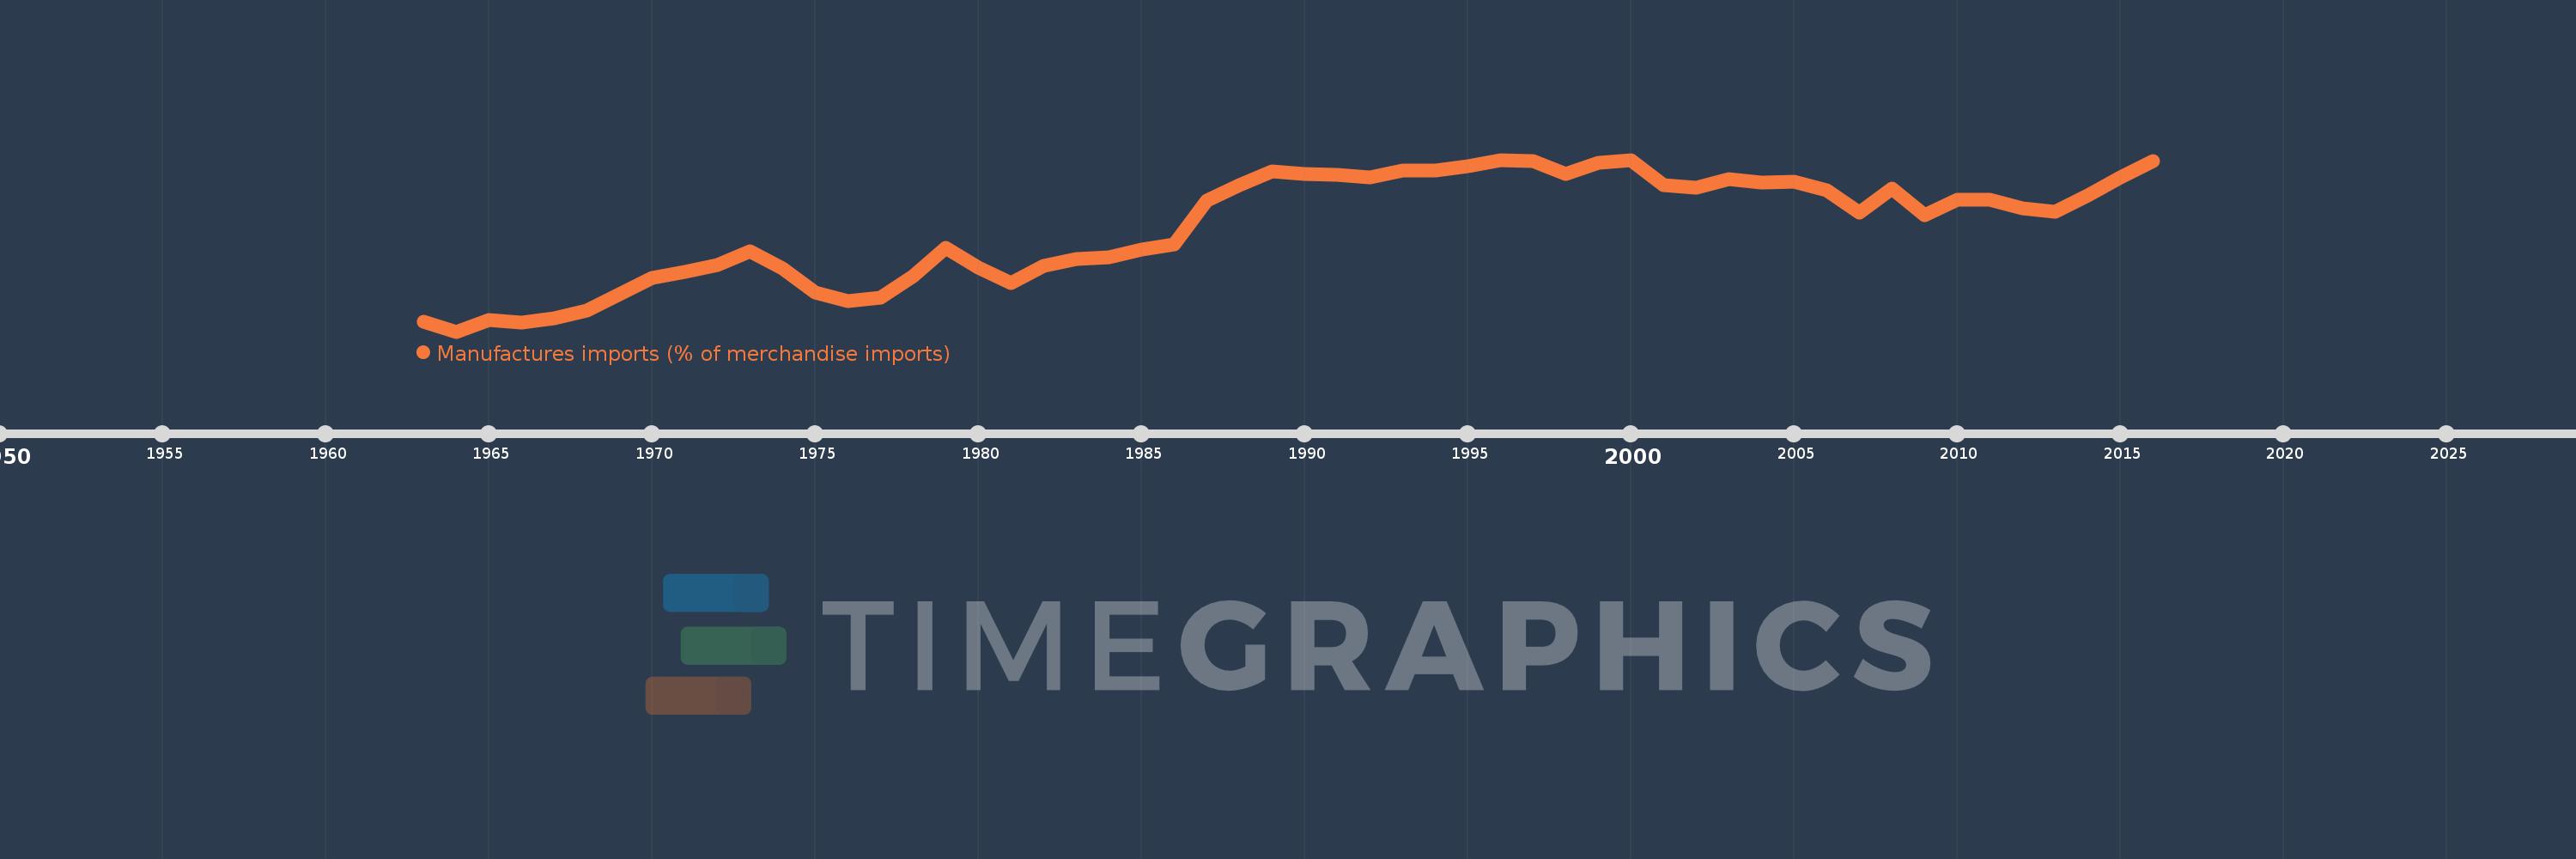
Manufactures imports (% of merchandise imports)
2016,2015,2014,2013,2012,2011,2010,2009,2008,2007,2006,2005,2004,2003,2002,2001,2000,1999,1998,1997,1996,1995,1994,1993,1992,1991,1990,1989,1988,1987,1986,1985,1984,1983,1982,1981,1980,1979,1978,1977,1976,1975,1974,1973,1972,1971,1970,1969,1968,1967,1966,1965,1964,1963
This statistics in other country:
AfghanistanAlbaniaAlgeriaAndorraAngolaAntigua and BarbudaArab WorldArgentinaArmeniaArubaAustraliaAustriaAzerbaijanBahamas, TheBahrainBangladeshBarbadosBelarusBelgiumBelizeBeninBermudaBhutanBoliviaBosnia and HerzegovinaBotswanaBrazilBrunei DarussalamBulgariaBurkina FasoBurundiCabo VerdeCambodiaCameroonCanadaCaribbean small statesCayman IslandsCentral African RepublicCentral Europe and the BalticsChadChileChinaColombiaComorosCongo, Dem. Rep.Congo, Rep.Costa RicaCote d'IvoireCroatiaCubaCyprusCzech RepublicDenmarkDjiboutiDominicaDominican RepublicEarly-demographic dividendEast Asia & PacificEast Asia & Pacific (excluding high income)East Asia & Pacific (IDA & IBRD countries)EcuadorEgypt, Arab Rep.El SalvadorEquatorial GuineaEritreaEstoniaEthiopiaEuro areaEurope & Central AsiaEurope & Central Asia (excluding high income)Europe & Central Asia (IDA & IBRD countries)European UnionFaroe IslandsFijiFinlandFragile and conflict affected situationsFranceFrench PolynesiaGabonGambia, TheGeorgiaGermanyGhanaGreeceGreenlandGrenadaGuatemalaGuineaGuinea-BissauGuyanaHaitiHeavily indebted poor countries (HIPC)High incomeHondurasHong Kong SAR, ChinaHungaryIBRD onlyIcelandIDA & IBRD totalIDA blendIDA onlyIDA totalIndiaIndonesiaIran, Islamic Rep.IraqIrelandIsraelItalyJamaicaJapanJordanKazakhstanKenyaKiribatiKorea, Rep.KuwaitKyrgyz RepublicLao PDRLate-demographic dividendLatin America & Caribbean Latin America & Caribbean (excluding high income)Latin America & the Caribbean (IDA & IBRD countries)LatviaLeast developed countries: UN classificationLebanonLesothoLiberiaLibyaLithuaniaLow & middle incomeLow incomeLower middle incomeLuxembourgMacao SAR, ChinaMacedonia, FYRMadagascarMalawiMalaysiaMaldivesMaliMaltaMauritaniaMauritiusMexicoMiddle East & North AfricaMiddle East & North Africa (excluding high income)Middle East & North Africa (IDA & IBRD countries)Middle incomeMoldovaMongoliaMoroccoMozambiqueMyanmarNamibiaNepalNetherlandsNew CaledoniaNew ZealandNicaraguaNigerNigeriaNorth AmericaNorwayOECD membersOmanOther small statesPacific island small statesPakistanPalauPanamaPapua New GuineaParaguayPeruPhilippinesPolandPortugalPost-demographic dividendPre-demographic dividendQatarRomaniaRussian FederationRwandaSamoaSao Tome and PrincipeSaudi ArabiaSenegalSerbiaSeychellesSierra LeoneSingaporeSlovak RepublicSloveniaSmall statesSolomon IslandsSomaliaSouth AfricaSouth AsiaSouth Asia (IDA & IBRD)SpainSri LankaSt. Kitts and NevisSt. LuciaSt. Vincent and the GrenadinesSub-Saharan Africa Sub-Saharan Africa (excluding high income)Sub-Saharan Africa (IDA & IBRD countries)SudanSurinameSwazilandSwedenSwitzerlandSyrian Arab RepublicTajikistanTanzaniaThailandTimor-LesteTogoTongaTrinidad and TobagoTunisiaTurkeyTurkmenistanTurks and Caicos IslandsTuvaluUgandaUkraineUnited Arab EmiratesUnited KingdomUnited StatesUpper middle incomeUruguayVanuatuVenezuela, RBVietnamVirgin Islands (U.S.)WorldYemen, Rep.ZambiaZimbabwe Timeline:
This timeline shows a graph from 1963 to 2016 of Switzerland. No data until 1962. Number of actual observations by date: 54.
Source name:
World Development Indicators
Source organization:
World Bank staff estimates from the Comtrade database maintained by the United Nations Statistics Division.
Categories, topics:
Private Sector, Trade
Last updated:
apr 23, 2017
Indicators value changes by year
Minimum:
65.165
jan 1, 1964
At the date of observation
Value
Absolute change
Change from previous value
jan 1, 1963
66.305
+66.305
0.0%
jan 1, 1964
65.165
-1.141
-1.72%
jan 1, 1965
66.508
+1.343
2.06%
jan 1, 1966
66.244
-0.263
-0.4%
jan 1, 1967
66.759
+0.514
0.78%
jan 1, 1968
67.619
+0.86
1.29%
jan 1, 1969
69.559
+1.94
2.87%
jan 1, 1970
71.5
+1.942
2.79%
jan 1, 1971
72.223
+0.722
1.01%
jan 1, 1972
72.972
+0.749
1.04%
jan 1, 1973
74.585
+1.613
2.21%
jan 1, 1974
72.598
-1.987
-2.66%
jan 1, 1975
69.814
-2.784
-3.83%
jan 1, 1976
68.72
-1.095
-1.57%
jan 1, 1977
69.206
+0.486
0.71%
jan 1, 1978
71.72
+2.514
3.63%
jan 1, 1979
75.001
+3.281
4.57%
jan 1, 1980
72.705
-2.296
-3.06%
jan 1, 1981
70.915
-1.79
-2.46%
jan 1, 1982
72.88
+1.965
2.77%
jan 1, 1983
73.729
+0.849
1.16%
jan 1, 1984
73.891
+0.162
0.22%
jan 1, 1985
74.781
+0.89
1.2%
jan 1, 1986
75.416
+0.634
0.85%
jan 1, 1987
80.576
+5.161
6.84%
jan 1, 1988
82.434
+1.857
2.3%
jan 1, 1989
84.016
+1.583
1.92%
jan 1, 1990
83.762
-0.254
-0.3%
jan 1, 1991
83.647
-0.115
-0.14%
jan 1, 1992
83.349
-0.298
-0.36%
jan 1, 1993
84.153
+0.804
0.96%
jan 1, 1994
84.12
-0.033
-0.04%
jan 1, 1995
84.601
+0.48
0.57%
jan 1, 1996
85.4
+0.8
0.95%
jan 1, 1997
85.283
-0.117
-0.14%
jan 1, 1998
83.755
-1.528
-1.79%
jan 1, 1999
85.015
+1.261
1.51%
jan 1, 2000
85.315
+0.299
0.35%
jan 1, 2001
82.456
-2.859
-3.35%
jan 1, 2002
82.094
-0.362
-0.44%
jan 1, 2003
83.101
+1.007
1.23%
jan 1, 2004
82.764
-0.337
-0.41%
jan 1, 2005
82.822
+0.058
0.07%
jan 1, 2006
81.764
-1.058
-1.28%
jan 1, 2007
79.165
-2.599
-3.18%
jan 1, 2008
82.055
+2.89
3.65%
jan 1, 2009
78.922
-3.133
-3.82%
jan 1, 2010
80.711
+1.789
2.27%
jan 1, 2011
80.651
-0.06
-0.07%
jan 1, 2012
79.733
-0.918
-1.14%
jan 1, 2013
79.32
-0.413
-0.52%
jan 1, 2014
81.25
+1.93
2.43%
jan 1, 2015
83.312
+2.062
2.54%
jan 1, 2016
85.296
+1.984
2.38%
Ranking of countries by current statistics by years


Comments: