29
/
en
AIzaSyAYiBZKx7MnpbEhh9jyipgxe19OcubqV5w
April 1, 2024
208170
Netherlands
NLD
true
2
1
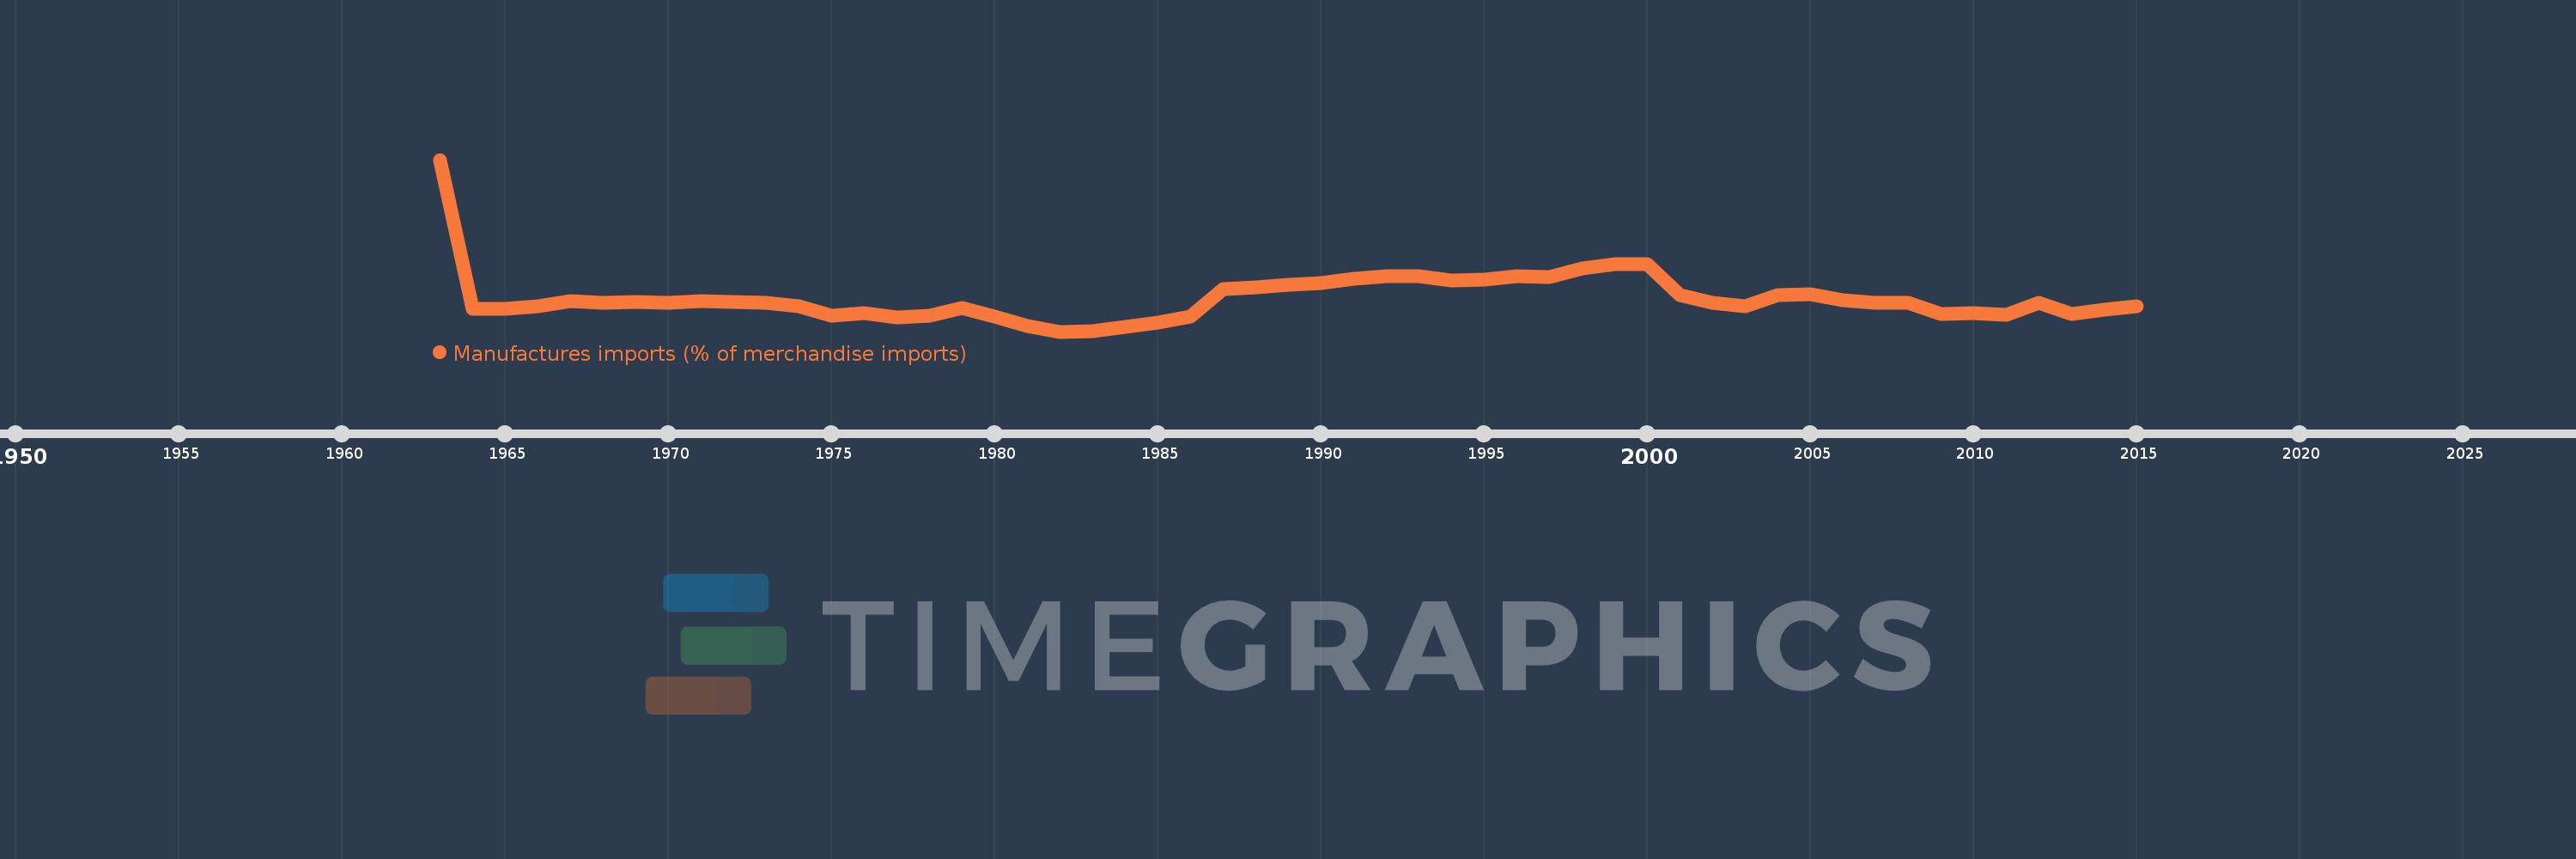
Manufactures imports (% of merchandise imports)
2015,2014,2013,2012,2011,2010,2009,2008,2007,2006,2005,2004,2003,2002,2001,2000,1999,1998,1997,1996,1995,1994,1993,1992,1991,1990,1989,1988,1987,1986,1985,1984,1983,1982,1981,1980,1979,1978,1977,1976,1975,1974,1973,1972,1971,1970,1969,1968,1967,1966,1965,1964,1963
This statistics in other country:
AfghanistanAlbaniaAlgeriaAndorraAngolaAntigua and BarbudaArab WorldArgentinaArmeniaArubaAustraliaAustriaAzerbaijanBahamas, TheBahrainBangladeshBarbadosBelarusBelgiumBelizeBeninBermudaBhutanBoliviaBosnia and HerzegovinaBotswanaBrazilBrunei DarussalamBulgariaBurkina FasoBurundiCabo VerdeCambodiaCameroonCanadaCaribbean small statesCayman IslandsCentral African RepublicCentral Europe and the BalticsChadChileChinaColombiaComorosCongo, Dem. Rep.Congo, Rep.Costa RicaCote d'IvoireCroatiaCubaCyprusCzech RepublicDenmarkDjiboutiDominicaDominican RepublicEarly-demographic dividendEast Asia & PacificEast Asia & Pacific (excluding high income)East Asia & Pacific (IDA & IBRD countries)EcuadorEgypt, Arab Rep.El SalvadorEquatorial GuineaEritreaEstoniaEthiopiaEuro areaEurope & Central AsiaEurope & Central Asia (excluding high income)Europe & Central Asia (IDA & IBRD countries)European UnionFaroe IslandsFijiFinlandFragile and conflict affected situationsFranceFrench PolynesiaGabonGambia, TheGeorgiaGermanyGhanaGreeceGreenlandGrenadaGuatemalaGuineaGuinea-BissauGuyanaHaitiHeavily indebted poor countries (HIPC)High incomeHondurasHong Kong SAR, ChinaHungaryIBRD onlyIcelandIDA & IBRD totalIDA blendIDA onlyIDA totalIndiaIndonesiaIran, Islamic Rep.IraqIrelandIsraelItalyJamaicaJapanJordanKazakhstanKenyaKiribatiKorea, Rep.KuwaitKyrgyz RepublicLao PDRLate-demographic dividendLatin America & Caribbean Latin America & Caribbean (excluding high income)Latin America & the Caribbean (IDA & IBRD countries)LatviaLeast developed countries: UN classificationLebanonLesothoLiberiaLibyaLithuaniaLow & middle incomeLow incomeLower middle incomeLuxembourgMacao SAR, ChinaMacedonia, FYRMadagascarMalawiMalaysiaMaldivesMaliMaltaMauritaniaMauritiusMexicoMiddle East & North AfricaMiddle East & North Africa (excluding high income)Middle East & North Africa (IDA & IBRD countries)Middle incomeMoldovaMongoliaMoroccoMozambiqueMyanmarNamibiaNepalNetherlandsNew CaledoniaNew ZealandNicaraguaNigerNigeriaNorth AmericaNorwayOECD membersOmanOther small statesPacific island small statesPakistanPalauPanamaPapua New GuineaParaguayPeruPhilippinesPolandPortugalPost-demographic dividendPre-demographic dividendQatarRomaniaRussian FederationRwandaSamoaSao Tome and PrincipeSaudi ArabiaSenegalSerbiaSeychellesSierra LeoneSingaporeSlovak RepublicSloveniaSmall statesSolomon IslandsSomaliaSouth AfricaSouth AsiaSouth Asia (IDA & IBRD)SpainSri LankaSt. Kitts and NevisSt. LuciaSt. Vincent and the GrenadinesSub-Saharan Africa Sub-Saharan Africa (excluding high income)Sub-Saharan Africa (IDA & IBRD countries)SudanSurinameSwazilandSwedenSwitzerlandSyrian Arab RepublicTajikistanTanzaniaThailandTimor-LesteTogoTongaTrinidad and TobagoTunisiaTurkeyTurkmenistanTurks and Caicos IslandsTuvaluUgandaUkraineUnited Arab EmiratesUnited KingdomUnited StatesUpper middle incomeUruguayVanuatuVenezuela, RBVietnamVirgin Islands (U.S.)WorldYemen, Rep.ZambiaZimbabwe Timeline:
This timeline shows a graph from 1963 to 2015 of Netherlands. No data until 1962. Number of actual observations by date: 53.
Source name:
World Development Indicators
Source organization:
World Bank staff estimates from the Comtrade database maintained by the United Nations Statistics Division.
Categories, topics:
Private Sector, Trade
Last updated:
apr 23, 2017
Indicators value changes by year
Minimum:
51.237
jan 1, 1982
Maximum:
116.211
jan 1, 1963
At the date of observation
Value
Absolute change
Change from previous value
jan 1, 1963
116.211
+116.211
0.0%
jan 1, 1964
59.772
-56.44
-48.57%
jan 1, 1965
59.779
+0.007
0.01%
jan 1, 1966
60.915
+1.136
1.9%
jan 1, 1967
62.62
+1.705
2.8%
jan 1, 1968
62.033
-0.586
-0.94%
jan 1, 1969
62.56
+0.527
0.85%
jan 1, 1970
62.209
-0.352
-0.56%
jan 1, 1971
62.778
+0.569
0.91%
jan 1, 1972
62.297
-0.481
-0.77%
jan 1, 1973
62.013
-0.284
-0.46%
jan 1, 1974
60.682
-1.331
-2.15%
jan 1, 1975
57.146
-3.536
-5.83%
jan 1, 1976
58.065
+0.919
1.61%
jan 1, 1977
56.67
-1.394
-2.4%
jan 1, 1978
57.251
+0.581
1.02%
jan 1, 1979
60.061
+2.81
4.91%
jan 1, 1980
57.014
-3.047
-5.07%
jan 1, 1981
53.447
-3.567
-6.26%
jan 1, 1982
51.237
-2.209
-4.13%
jan 1, 1983
51.468
+0.23
0.45%
jan 1, 1984
53.134
+1.667
3.24%
jan 1, 1985
54.545
+1.41
2.65%
jan 1, 1986
57.005
+2.46
4.51%
jan 1, 1987
67.237
+10.232
17.95%
jan 1, 1988
68.058
+0.822
1.22%
jan 1, 1989
68.8
+0.742
1.09%
jan 1, 1990
69.703
+0.903
1.31%
jan 1, 1991
71.092
+1.388
1.99%
jan 1, 1992
72.215
+1.124
1.58%
jan 1, 1993
72.247
+0.032
0.04%
jan 1, 1994
70.445
-1.803
-2.5%
jan 1, 1995
70.906
+0.461
0.65%
jan 1, 1996
72.19
+1.284
1.81%
jan 1, 1997
71.938
-0.252
-0.35%
jan 1, 1998
75.171
+3.233
4.49%
jan 1, 1999
76.876
+1.705
2.27%
jan 1, 2000
76.67
-0.205
-0.27%
jan 1, 2001
65.098
-11.572
-15.09%
jan 1, 2002
62.07
-3.029
-4.65%
jan 1, 2003
60.707
-1.362
-2.19%
jan 1, 2004
65.023
+4.316
7.11%
jan 1, 2005
65.291
+0.267
0.41%
jan 1, 2006
63.1
-2.19
-3.35%
jan 1, 2007
62.089
-1.011
-1.6%
jan 1, 2008
62.038
-0.051
-0.08%
jan 1, 2009
57.968
-4.07
-6.56%
jan 1, 2010
58.336
+0.368
0.63%
jan 1, 2011
57.411
-0.925
-1.59%
jan 1, 2012
62.162
+4.751
8.28%
jan 1, 2013
57.77
-4.392
-7.07%
jan 1, 2014
59.639
+1.869
3.23%
jan 1, 2015
60.962
+1.323
2.22%
Ranking of countries by current statistics by years


Comments: