29
/
en
AIzaSyAYiBZKx7MnpbEhh9jyipgxe19OcubqV5w
April 1, 2024
157544
Iran, Islamic Rep.
IRN
true
2
1
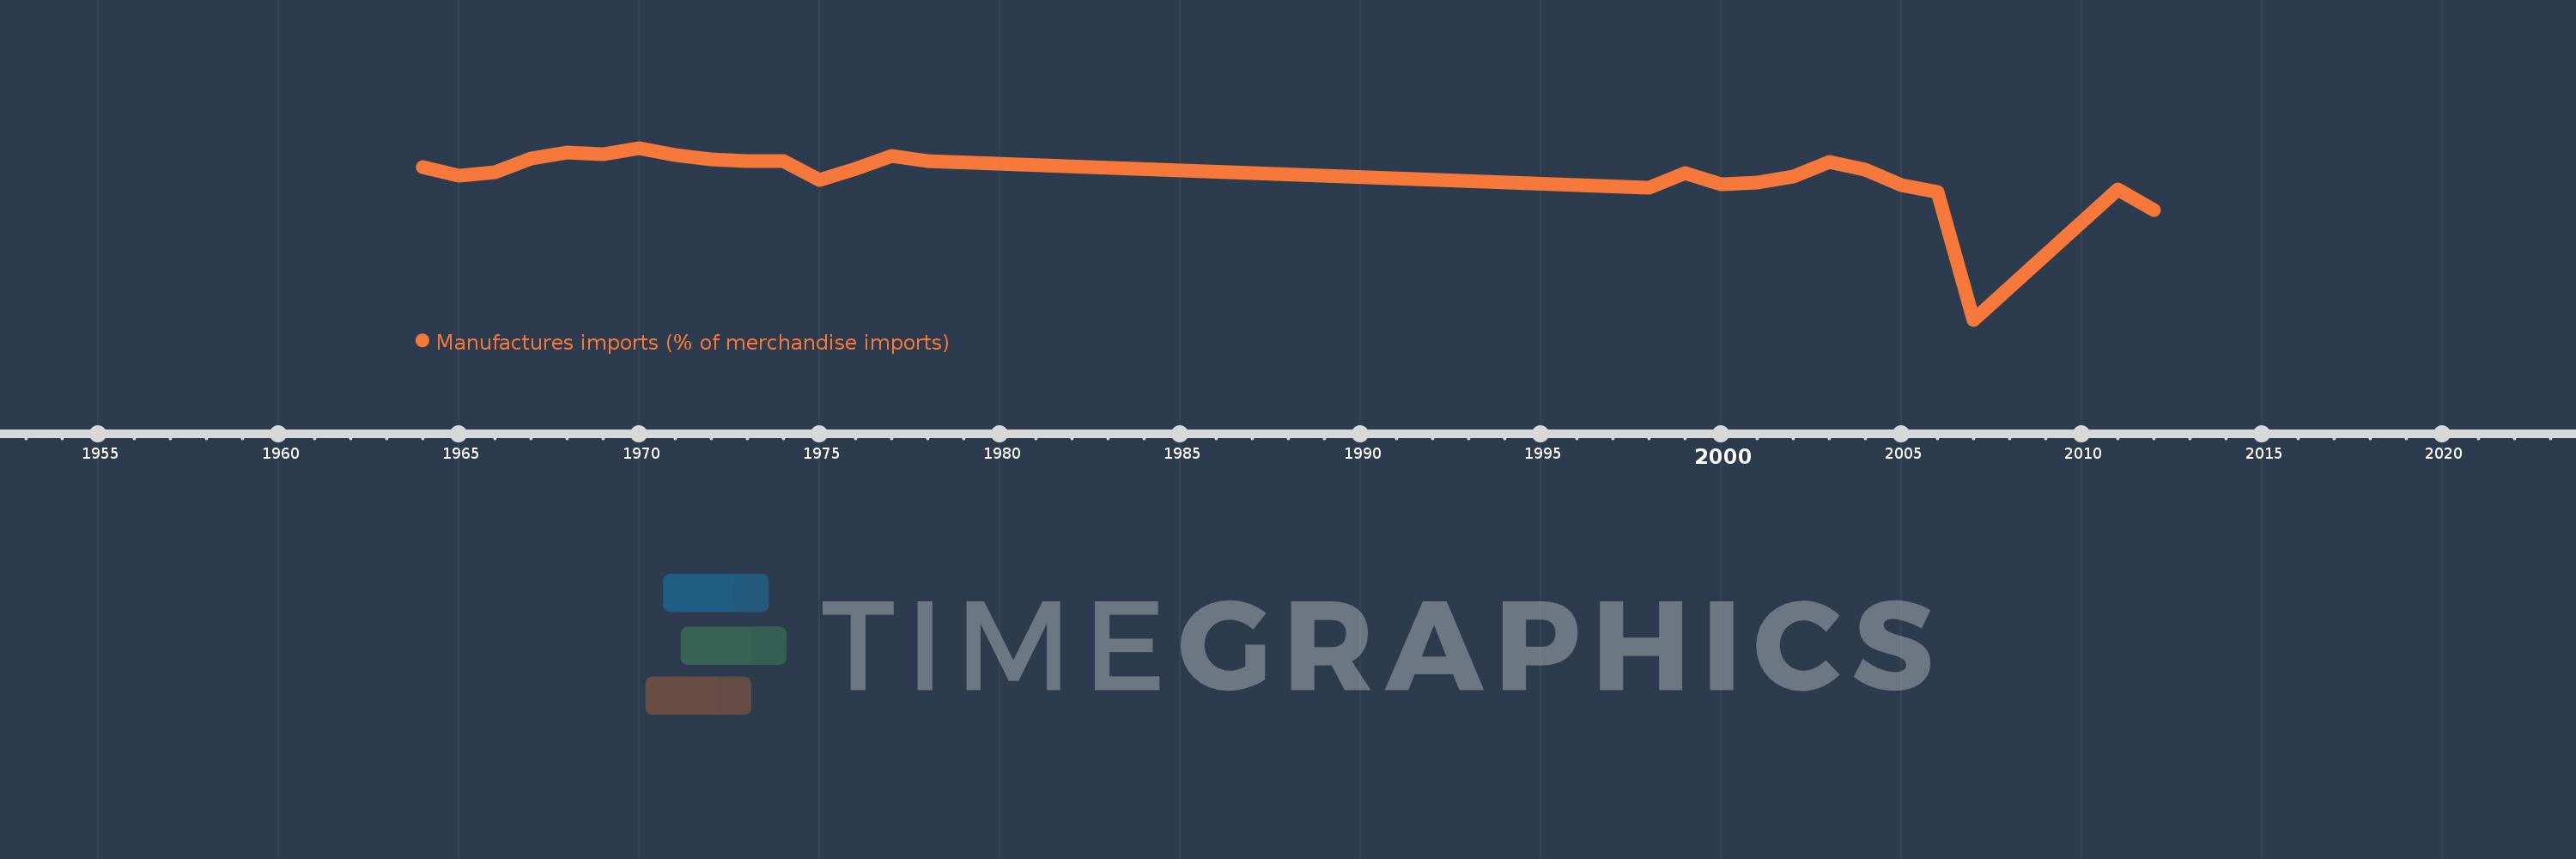
Manufactures imports (% of merchandise imports)
2012,2011,2007,2006,2005,2004,2003,2002,2001,2000,1999,1998,1978,1977,1976,1975,1974,1973,1972,1971,1970,1969,1968,1967,1966,1965,1964
This statistics in other country:
AfghanistanAlbaniaAlgeriaAndorraAngolaAntigua and BarbudaArab WorldArgentinaArmeniaArubaAustraliaAustriaAzerbaijanBahamas, TheBahrainBangladeshBarbadosBelarusBelgiumBelizeBeninBermudaBhutanBoliviaBosnia and HerzegovinaBotswanaBrazilBrunei DarussalamBulgariaBurkina FasoBurundiCabo VerdeCambodiaCameroonCanadaCaribbean small statesCayman IslandsCentral African RepublicCentral Europe and the BalticsChadChileChinaColombiaComorosCongo, Dem. Rep.Congo, Rep.Costa RicaCote d'IvoireCroatiaCubaCyprusCzech RepublicDenmarkDjiboutiDominicaDominican RepublicEarly-demographic dividendEast Asia & PacificEast Asia & Pacific (excluding high income)East Asia & Pacific (IDA & IBRD countries)EcuadorEgypt, Arab Rep.El SalvadorEquatorial GuineaEritreaEstoniaEthiopiaEuro areaEurope & Central AsiaEurope & Central Asia (excluding high income)Europe & Central Asia (IDA & IBRD countries)European UnionFaroe IslandsFijiFinlandFragile and conflict affected situationsFranceFrench PolynesiaGabonGambia, TheGeorgiaGermanyGhanaGreeceGreenlandGrenadaGuatemalaGuineaGuinea-BissauGuyanaHaitiHeavily indebted poor countries (HIPC)High incomeHondurasHong Kong SAR, ChinaHungaryIBRD onlyIcelandIDA & IBRD totalIDA blendIDA onlyIDA totalIndiaIndonesiaIran, Islamic Rep.IraqIrelandIsraelItalyJamaicaJapanJordanKazakhstanKenyaKiribatiKorea, Rep.KuwaitKyrgyz RepublicLao PDRLate-demographic dividendLatin America & Caribbean Latin America & Caribbean (excluding high income)Latin America & the Caribbean (IDA & IBRD countries)LatviaLeast developed countries: UN classificationLebanonLesothoLiberiaLibyaLithuaniaLow & middle incomeLow incomeLower middle incomeLuxembourgMacao SAR, ChinaMacedonia, FYRMadagascarMalawiMalaysiaMaldivesMaliMaltaMauritaniaMauritiusMexicoMiddle East & North AfricaMiddle East & North Africa (excluding high income)Middle East & North Africa (IDA & IBRD countries)Middle incomeMoldovaMongoliaMoroccoMozambiqueMyanmarNamibiaNepalNetherlandsNew CaledoniaNew ZealandNicaraguaNigerNigeriaNorth AmericaNorwayOECD membersOmanOther small statesPacific island small statesPakistanPalauPanamaPapua New GuineaParaguayPeruPhilippinesPolandPortugalPost-demographic dividendPre-demographic dividendQatarRomaniaRussian FederationRwandaSamoaSao Tome and PrincipeSaudi ArabiaSenegalSerbiaSeychellesSierra LeoneSingaporeSlovak RepublicSloveniaSmall statesSolomon IslandsSomaliaSouth AfricaSouth AsiaSouth Asia (IDA & IBRD)SpainSri LankaSt. Kitts and NevisSt. LuciaSt. Vincent and the GrenadinesSub-Saharan Africa Sub-Saharan Africa (excluding high income)Sub-Saharan Africa (IDA & IBRD countries)SudanSurinameSwazilandSwedenSwitzerlandSyrian Arab RepublicTajikistanTanzaniaThailandTimor-LesteTogoTongaTrinidad and TobagoTunisiaTurkeyTurkmenistanTurks and Caicos IslandsTuvaluUgandaUkraineUnited Arab EmiratesUnited KingdomUnited StatesUpper middle incomeUruguayVanuatuVenezuela, RBVietnamVirgin Islands (U.S.)WorldYemen, Rep.ZambiaZimbabwe Timeline:
This timeline shows a graph from 1964 to 2012 of Iran, Islamic Rep.. No data until 1963. Number of actual observations by date: 27.
Source name:
World Development Indicators
Source organization:
World Bank staff estimates from the Comtrade database maintained by the United Nations Statistics Division.
Categories, topics:
Private Sector, Trade
Last updated:
apr 23, 2017
Indicators value changes by year
Minimum:
16.295
jan 1, 2007
Maximum:
87.907
jan 1, 1970
At the date of observation
Value
Absolute change
Change from previous value
jan 1, 1964
79.878
+79.878
0.0%
jan 1, 1965
76.406
-3.471
-4.35%
jan 1, 1966
77.846
+1.44
1.88%
jan 1, 1967
83.36
+5.514
7.08%
jan 1, 1968
85.97
+2.61
3.13%
jan 1, 1969
85.397
-0.573
-0.67%
jan 1, 1970
87.907
+2.51
2.94%
jan 1, 1971
84.953
-2.955
-3.36%
jan 1, 1972
82.984
-1.969
-2.32%
jan 1, 1973
82.555
-0.429
-0.52%
jan 1, 1974
82.299
-0.256
-0.31%
jan 1, 1975
74.676
-7.623
-9.26%
jan 1, 1976
79.317
+4.642
6.22%
jan 1, 1977
84.422
+5.105
6.44%
jan 1, 1978
82.394
-2.028
-2.4%
jan 1, 1998
71.484
-10.91
-13.24%
jan 1, 1999
77.355
+5.87
8.21%
jan 1, 2000
72.742
-4.613
-5.96%
jan 1, 2001
73.313
+0.571
0.79%
jan 1, 2002
75.9
+2.587
3.53%
jan 1, 2003
82.019
+6.119
8.06%
jan 1, 2004
78.895
-3.124
-3.81%
jan 1, 2005
72.422
-6.474
-8.21%
jan 1, 2006
69.626
-2.795
-3.86%
jan 1, 2007
16.295
-53.331
-76.6%
jan 1, 2011
70.545
+54.25
332.92%
jan 1, 2012
62.11
-8.435
-11.96%
Ranking of countries by current statistics by years


Comments: