29
/
en
AIzaSyAYiBZKx7MnpbEhh9jyipgxe19OcubqV5w
April 1, 2024
262517
Thailand
THA
true
2
1
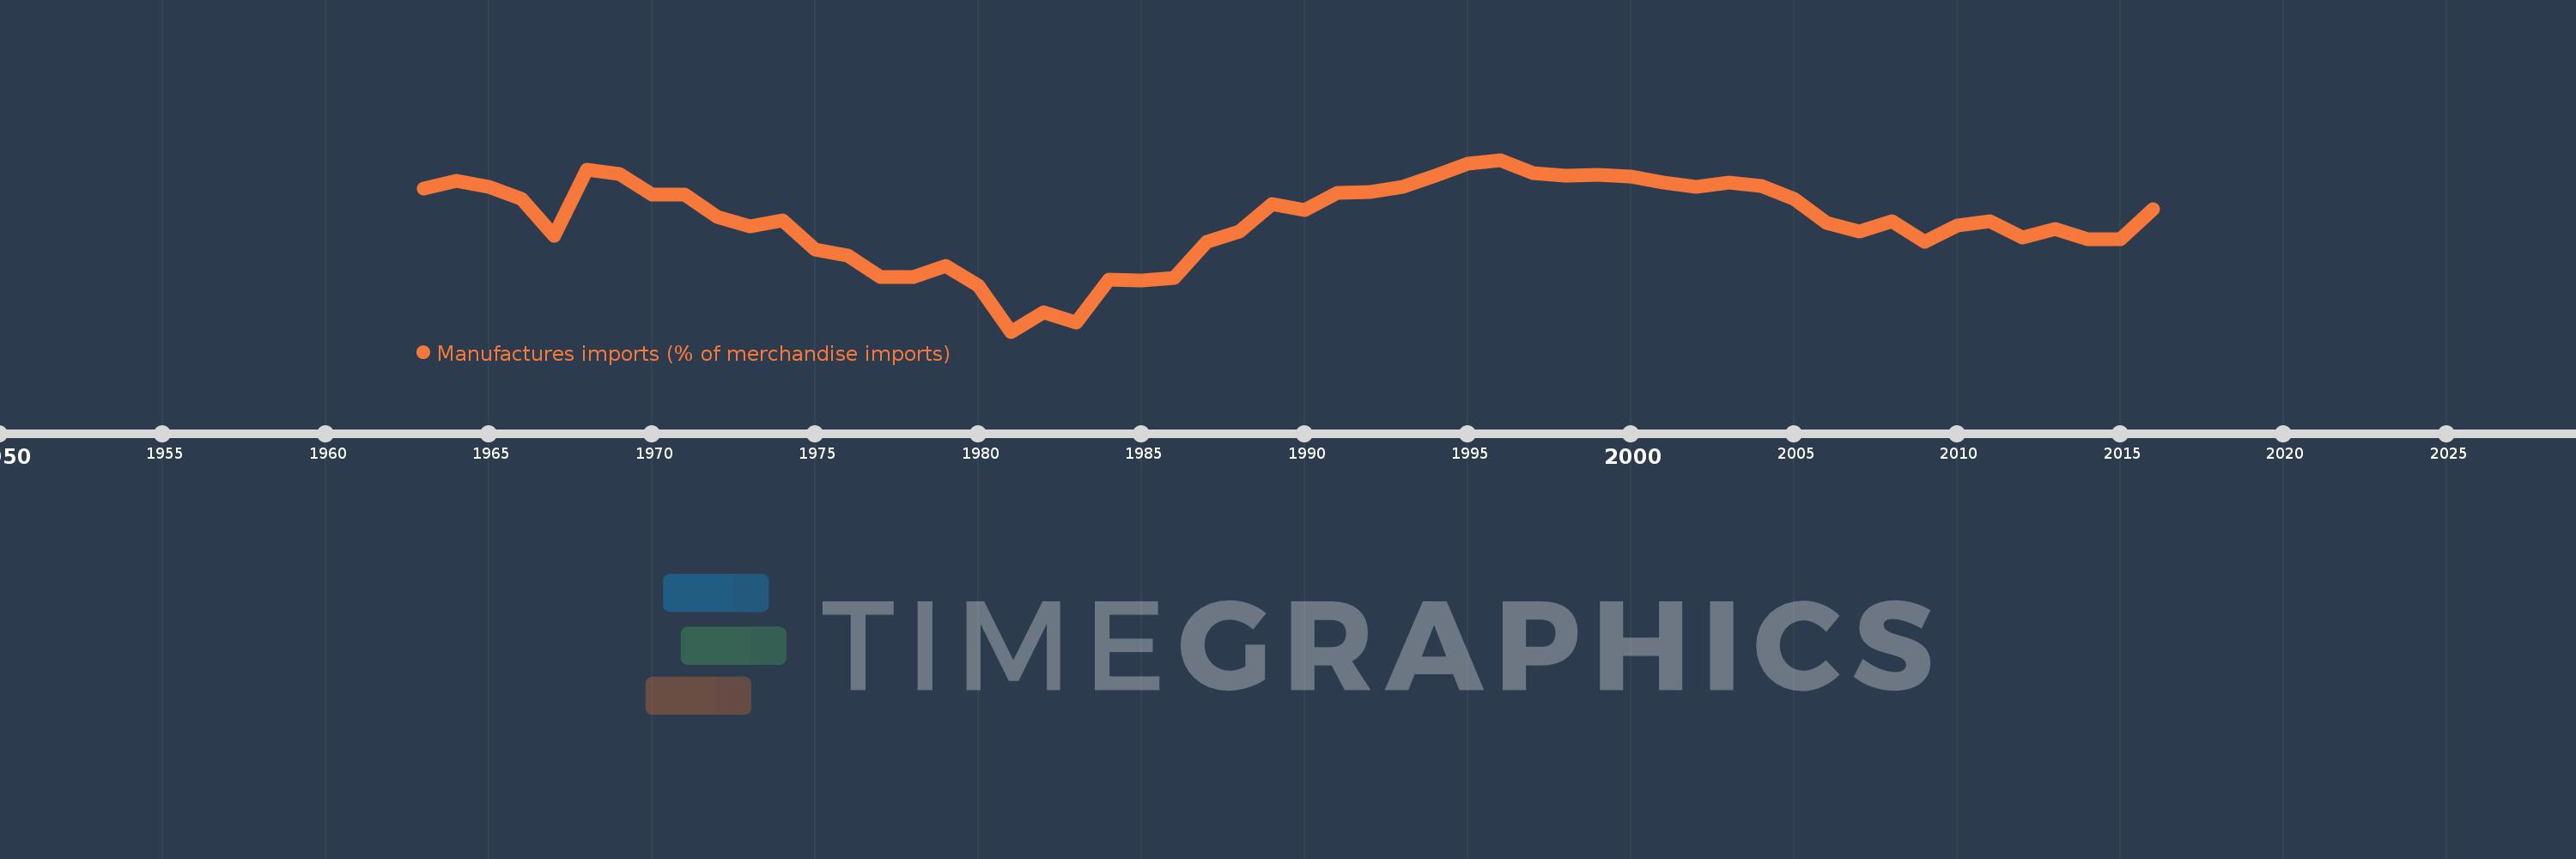
Manufactures imports (% of merchandise imports)
2016,2015,2014,2013,2012,2011,2010,2009,2008,2007,2006,2005,2004,2003,2002,2001,2000,1999,1998,1997,1996,1995,1994,1993,1992,1991,1990,1989,1988,1987,1986,1985,1984,1983,1982,1981,1980,1979,1978,1977,1976,1975,1974,1973,1972,1971,1970,1969,1968,1967,1966,1965,1964,1963
This statistics in other country:
AfghanistanAlbaniaAlgeriaAndorraAngolaAntigua and BarbudaArab WorldArgentinaArmeniaArubaAustraliaAustriaAzerbaijanBahamas, TheBahrainBangladeshBarbadosBelarusBelgiumBelizeBeninBermudaBhutanBoliviaBosnia and HerzegovinaBotswanaBrazilBrunei DarussalamBulgariaBurkina FasoBurundiCabo VerdeCambodiaCameroonCanadaCaribbean small statesCayman IslandsCentral African RepublicCentral Europe and the BalticsChadChileChinaColombiaComorosCongo, Dem. Rep.Congo, Rep.Costa RicaCote d'IvoireCroatiaCubaCyprusCzech RepublicDenmarkDjiboutiDominicaDominican RepublicEarly-demographic dividendEast Asia & PacificEast Asia & Pacific (excluding high income)East Asia & Pacific (IDA & IBRD countries)EcuadorEgypt, Arab Rep.El SalvadorEquatorial GuineaEritreaEstoniaEthiopiaEuro areaEurope & Central AsiaEurope & Central Asia (excluding high income)Europe & Central Asia (IDA & IBRD countries)European UnionFaroe IslandsFijiFinlandFragile and conflict affected situationsFranceFrench PolynesiaGabonGambia, TheGeorgiaGermanyGhanaGreeceGreenlandGrenadaGuatemalaGuineaGuinea-BissauGuyanaHaitiHeavily indebted poor countries (HIPC)High incomeHondurasHong Kong SAR, ChinaHungaryIBRD onlyIcelandIDA & IBRD totalIDA blendIDA onlyIDA totalIndiaIndonesiaIran, Islamic Rep.IraqIrelandIsraelItalyJamaicaJapanJordanKazakhstanKenyaKiribatiKorea, Rep.KuwaitKyrgyz RepublicLao PDRLate-demographic dividendLatin America & Caribbean Latin America & Caribbean (excluding high income)Latin America & the Caribbean (IDA & IBRD countries)LatviaLeast developed countries: UN classificationLebanonLesothoLiberiaLibyaLithuaniaLow & middle incomeLow incomeLower middle incomeLuxembourgMacao SAR, ChinaMacedonia, FYRMadagascarMalawiMalaysiaMaldivesMaliMaltaMauritaniaMauritiusMexicoMiddle East & North AfricaMiddle East & North Africa (excluding high income)Middle East & North Africa (IDA & IBRD countries)Middle incomeMoldovaMongoliaMoroccoMozambiqueMyanmarNamibiaNepalNetherlandsNew CaledoniaNew ZealandNicaraguaNigerNigeriaNorth AmericaNorwayOECD membersOmanOther small statesPacific island small statesPakistanPalauPanamaPapua New GuineaParaguayPeruPhilippinesPolandPortugalPost-demographic dividendPre-demographic dividendQatarRomaniaRussian FederationRwandaSamoaSao Tome and PrincipeSaudi ArabiaSenegalSerbiaSeychellesSierra LeoneSingaporeSlovak RepublicSloveniaSmall statesSolomon IslandsSomaliaSouth AfricaSouth AsiaSouth Asia (IDA & IBRD)SpainSri LankaSt. Kitts and NevisSt. LuciaSt. Vincent and the GrenadinesSub-Saharan Africa Sub-Saharan Africa (excluding high income)Sub-Saharan Africa (IDA & IBRD countries)SudanSurinameSwazilandSwedenSwitzerlandSyrian Arab RepublicTajikistanTanzaniaThailandTimor-LesteTogoTongaTrinidad and TobagoTunisiaTurkeyTurkmenistanTurks and Caicos IslandsTuvaluUgandaUkraineUnited Arab EmiratesUnited KingdomUnited StatesUpper middle incomeUruguayVanuatuVenezuela, RBVietnamVirgin Islands (U.S.)WorldYemen, Rep.ZambiaZimbabwe Timeline:
This timeline shows a graph from 1963 to 2016 of Thailand. No data until 1962. Number of actual observations by date: 54.
Source name:
World Development Indicators
Source organization:
World Bank staff estimates from the Comtrade database maintained by the United Nations Statistics Division.
Categories, topics:
Private Sector, Trade
Last updated:
apr 23, 2017
Indicators value changes by year
Minimum:
50.823
jan 1, 1981
Maximum:
80.701
jan 1, 1996
At the date of observation
Value
Absolute change
Change from previous value
jan 1, 1963
75.693
+75.693
0.0%
jan 1, 1964
77.115
+1.422
1.88%
jan 1, 1965
75.949
-1.166
-1.51%
jan 1, 1966
73.931
-2.018
-2.66%
jan 1, 1967
67.519
-6.412
-8.67%
jan 1, 1968
78.926
+11.407
16.89%
jan 1, 1969
78.26
-0.666
-0.84%
jan 1, 1970
74.687
-3.572
-4.56%
jan 1, 1971
74.718
+0.031
0.04%
jan 1, 1972
70.742
-3.976
-5.32%
jan 1, 1973
69.189
-1.553
-2.19%
jan 1, 1974
70.181
+0.992
1.43%
jan 1, 1975
65.018
-5.163
-7.36%
jan 1, 1976
64.112
-0.906
-1.39%
jan 1, 1977
60.354
-3.758
-5.86%
jan 1, 1978
60.254
-0.1
-0.17%
jan 1, 1979
62.291
+2.037
3.38%
jan 1, 1980
58.797
-3.494
-5.61%
jan 1, 1981
50.823
-7.974
-13.56%
jan 1, 1982
54.125
+3.302
6.5%
jan 1, 1983
52.369
-1.757
-3.25%
jan 1, 1984
59.903
+7.534
14.39%
jan 1, 1985
59.701
-0.202
-0.34%
jan 1, 1986
60.103
+0.403
0.67%
jan 1, 1987
66.387
+6.284
10.45%
jan 1, 1988
68.232
+1.846
2.78%
jan 1, 1989
73.059
+4.827
7.07%
jan 1, 1990
72.0
-1.06
-1.45%
jan 1, 1991
74.964
+2.964
4.12%
jan 1, 1992
75.154
+0.19
0.25%
jan 1, 1993
75.949
+0.795
1.06%
jan 1, 1994
77.87
+1.921
2.53%
jan 1, 1995
80.066
+2.196
2.82%
jan 1, 1996
80.701
+0.635
0.79%
jan 1, 1997
78.346
-2.356
-2.92%
jan 1, 1998
77.872
-0.473
-0.6%
jan 1, 1999
78.116
+0.243
0.31%
jan 1, 2000
77.802
-0.313
-0.4%
jan 1, 2001
76.675
-1.127
-1.45%
jan 1, 2002
75.987
-0.688
-0.9%
jan 1, 2003
76.696
+0.709
0.93%
jan 1, 2004
76.096
-0.6
-0.78%
jan 1, 2005
73.935
-2.161
-2.84%
jan 1, 2006
69.713
-4.222
-5.71%
jan 1, 2007
68.186
-1.527
-2.19%
jan 1, 2008
69.952
+1.766
2.59%
jan 1, 2009
66.383
-3.569
-5.1%
jan 1, 2010
69.246
+2.863
4.31%
jan 1, 2011
70.009
+0.763
1.1%
jan 1, 2012
67.254
-2.755
-3.94%
jan 1, 2013
68.737
+1.483
2.2%
jan 1, 2014
66.906
-1.83
-2.66%
jan 1, 2015
66.924
+0.018
0.03%
jan 1, 2016
72.164
+5.24
7.83%
Ranking of countries by current statistics by years


Comments: