29
/
en
AIzaSyAYiBZKx7MnpbEhh9jyipgxe19OcubqV5w
April 1, 2024
35922
High income
HIC
false
2
1
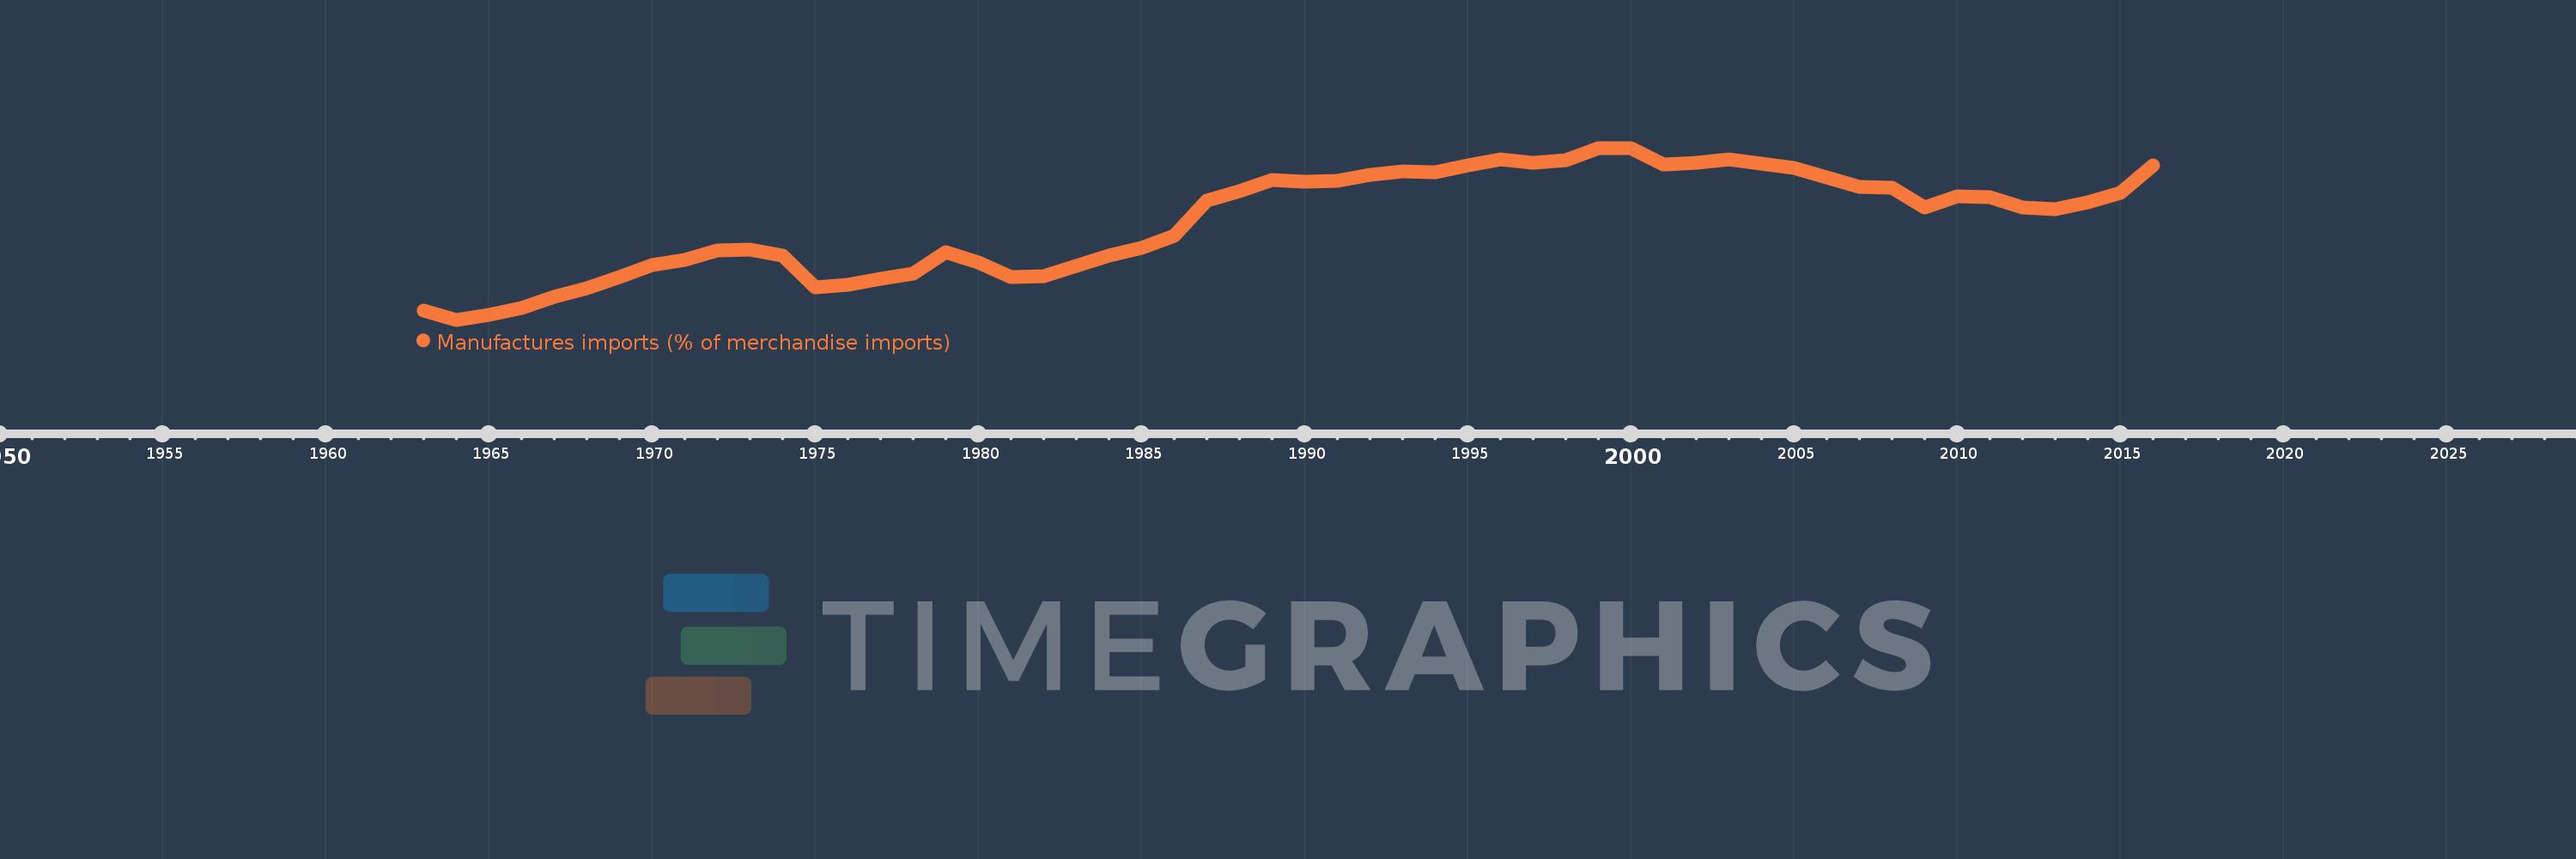
Manufactures imports (% of merchandise imports)
2016,2015,2014,2013,2012,2011,2010,2009,2008,2007,2006,2005,2004,2003,2002,2001,2000,1999,1998,1997,1996,1995,1994,1993,1992,1991,1990,1989,1988,1987,1986,1985,1984,1983,1982,1981,1980,1979,1978,1977,1976,1975,1974,1973,1972,1971,1970,1969,1968,1967,1966,1965,1964,1963
This statistics in other country:
AfghanistanAlbaniaAlgeriaAndorraAngolaAntigua and BarbudaArab WorldArgentinaArmeniaArubaAustraliaAustriaAzerbaijanBahamas, TheBahrainBangladeshBarbadosBelarusBelgiumBelizeBeninBermudaBhutanBoliviaBosnia and HerzegovinaBotswanaBrazilBrunei DarussalamBulgariaBurkina FasoBurundiCabo VerdeCambodiaCameroonCanadaCaribbean small statesCayman IslandsCentral African RepublicCentral Europe and the BalticsChadChileChinaColombiaComorosCongo, Dem. Rep.Congo, Rep.Costa RicaCote d'IvoireCroatiaCubaCyprusCzech RepublicDenmarkDjiboutiDominicaDominican RepublicEarly-demographic dividendEast Asia & PacificEast Asia & Pacific (excluding high income)East Asia & Pacific (IDA & IBRD countries)EcuadorEgypt, Arab Rep.El SalvadorEquatorial GuineaEritreaEstoniaEthiopiaEuro areaEurope & Central AsiaEurope & Central Asia (excluding high income)Europe & Central Asia (IDA & IBRD countries)European UnionFaroe IslandsFijiFinlandFragile and conflict affected situationsFranceFrench PolynesiaGabonGambia, TheGeorgiaGermanyGhanaGreeceGreenlandGrenadaGuatemalaGuineaGuinea-BissauGuyanaHaitiHeavily indebted poor countries (HIPC)High incomeHondurasHong Kong SAR, ChinaHungaryIBRD onlyIcelandIDA & IBRD totalIDA blendIDA onlyIDA totalIndiaIndonesiaIran, Islamic Rep.IraqIrelandIsraelItalyJamaicaJapanJordanKazakhstanKenyaKiribatiKorea, Rep.KuwaitKyrgyz RepublicLao PDRLate-demographic dividendLatin America & Caribbean Latin America & Caribbean (excluding high income)Latin America & the Caribbean (IDA & IBRD countries)LatviaLeast developed countries: UN classificationLebanonLesothoLiberiaLibyaLithuaniaLow & middle incomeLow incomeLower middle incomeLuxembourgMacao SAR, ChinaMacedonia, FYRMadagascarMalawiMalaysiaMaldivesMaliMaltaMauritaniaMauritiusMexicoMiddle East & North AfricaMiddle East & North Africa (excluding high income)Middle East & North Africa (IDA & IBRD countries)Middle incomeMoldovaMongoliaMoroccoMozambiqueMyanmarNamibiaNepalNetherlandsNew CaledoniaNew ZealandNicaraguaNigerNigeriaNorth AmericaNorwayOECD membersOmanOther small statesPacific island small statesPakistanPalauPanamaPapua New GuineaParaguayPeruPhilippinesPolandPortugalPost-demographic dividendPre-demographic dividendQatarRomaniaRussian FederationRwandaSamoaSao Tome and PrincipeSaudi ArabiaSenegalSerbiaSeychellesSierra LeoneSingaporeSlovak RepublicSloveniaSmall statesSolomon IslandsSomaliaSouth AfricaSouth AsiaSouth Asia (IDA & IBRD)SpainSri LankaSt. Kitts and NevisSt. LuciaSt. Vincent and the GrenadinesSub-Saharan Africa Sub-Saharan Africa (excluding high income)Sub-Saharan Africa (IDA & IBRD countries)SudanSurinameSwazilandSwedenSwitzerlandSyrian Arab RepublicTajikistanTanzaniaThailandTimor-LesteTogoTongaTrinidad and TobagoTunisiaTurkeyTurkmenistanTurks and Caicos IslandsTuvaluUgandaUkraineUnited Arab EmiratesUnited KingdomUnited StatesUpper middle incomeUruguayVanuatuVenezuela, RBVietnamVirgin Islands (U.S.)WorldYemen, Rep.ZambiaZimbabwe Timeline:
This timeline shows a graph from 1963 to 2016 of High income. No data until 1962. Number of actual observations by date: 54.
Source name:
World Development Indicators
Source organization:
World Bank staff estimates from the Comtrade database maintained by the United Nations Statistics Division.
Categories, topics:
Private Sector, Trade
Last updated:
apr 23, 2017
Indicators value changes by year
Minimum:
45.851
jan 1, 1964
Maximum:
77.333
jan 1, 1999
At the date of observation
Value
Absolute change
Change from previous value
jan 1, 1963
47.523
+47.523
0.0%
jan 1, 1964
45.851
-1.672
-3.52%
jan 1, 1965
46.808
+0.958
2.09%
jan 1, 1966
48.042
+1.233
2.63%
jan 1, 1967
50.086
+2.045
4.26%
jan 1, 1968
51.588
+1.502
3.0%
jan 1, 1969
53.715
+2.127
4.12%
jan 1, 1970
55.806
+2.092
3.89%
jan 1, 1971
56.791
+0.985
1.76%
jan 1, 1972
58.588
+1.797
3.16%
jan 1, 1973
58.717
+0.13
0.22%
jan 1, 1974
57.686
-1.031
-1.76%
jan 1, 1975
51.751
-5.935
-10.29%
jan 1, 1976
52.332
+0.581
1.12%
jan 1, 1977
53.323
+0.992
1.89%
jan 1, 1978
54.291
+0.967
1.81%
jan 1, 1979
58.17
+3.88
7.15%
jan 1, 1980
56.357
-1.813
-3.12%
jan 1, 1981
53.61
-2.747
-4.87%
jan 1, 1982
53.772
+0.162
0.3%
jan 1, 1983
55.679
+1.907
3.55%
jan 1, 1984
57.667
+1.989
3.57%
jan 1, 1985
59.051
+1.384
2.4%
jan 1, 1986
61.176
+2.125
3.6%
jan 1, 1987
67.737
+6.561
10.72%
jan 1, 1988
69.38
+1.644
2.43%
jan 1, 1989
71.39
+2.009
2.9%
jan 1, 1990
71.191
-0.199
-0.28%
jan 1, 1991
71.344
+0.153
0.22%
jan 1, 1992
72.419
+1.074
1.51%
jan 1, 1993
73.003
+0.584
0.81%
jan 1, 1994
72.902
-0.101
-0.14%
jan 1, 1995
74.142
+1.24
1.7%
jan 1, 1996
75.241
+1.1
1.48%
jan 1, 1997
74.671
-0.57
-0.76%
jan 1, 1998
75.042
+0.371
0.5%
jan 1, 1999
77.333
+2.291
3.05%
jan 1, 2000
77.304
-0.029
-0.04%
jan 1, 2001
74.308
-2.996
-3.88%
jan 1, 2002
74.682
+0.374
0.5%
jan 1, 2003
75.215
+0.533
0.71%
jan 1, 2004
74.396
-0.819
-1.09%
jan 1, 2005
73.683
-0.713
-0.96%
jan 1, 2006
71.939
-1.744
-2.37%
jan 1, 2007
70.271
-1.667
-2.32%
jan 1, 2008
70.06
-0.212
-0.3%
jan 1, 2009
66.418
-3.642
-5.2%
jan 1, 2010
68.414
+1.997
3.01%
jan 1, 2011
68.259
-0.155
-0.23%
jan 1, 2012
66.406
-1.853
-2.71%
jan 1, 2013
66.15
-0.256
-0.39%
jan 1, 2014
67.31
+1.16
1.75%
jan 1, 2015
69.132
+1.822
2.71%
jan 1, 2016
74.131
+4.998
7.23%
Ranking of countries by current statistics by years


Comments: