29
/
en
AIzaSyAYiBZKx7MnpbEhh9jyipgxe19OcubqV5w
April 1, 2024
76386
Bahamas, The
BHS
true
2
1
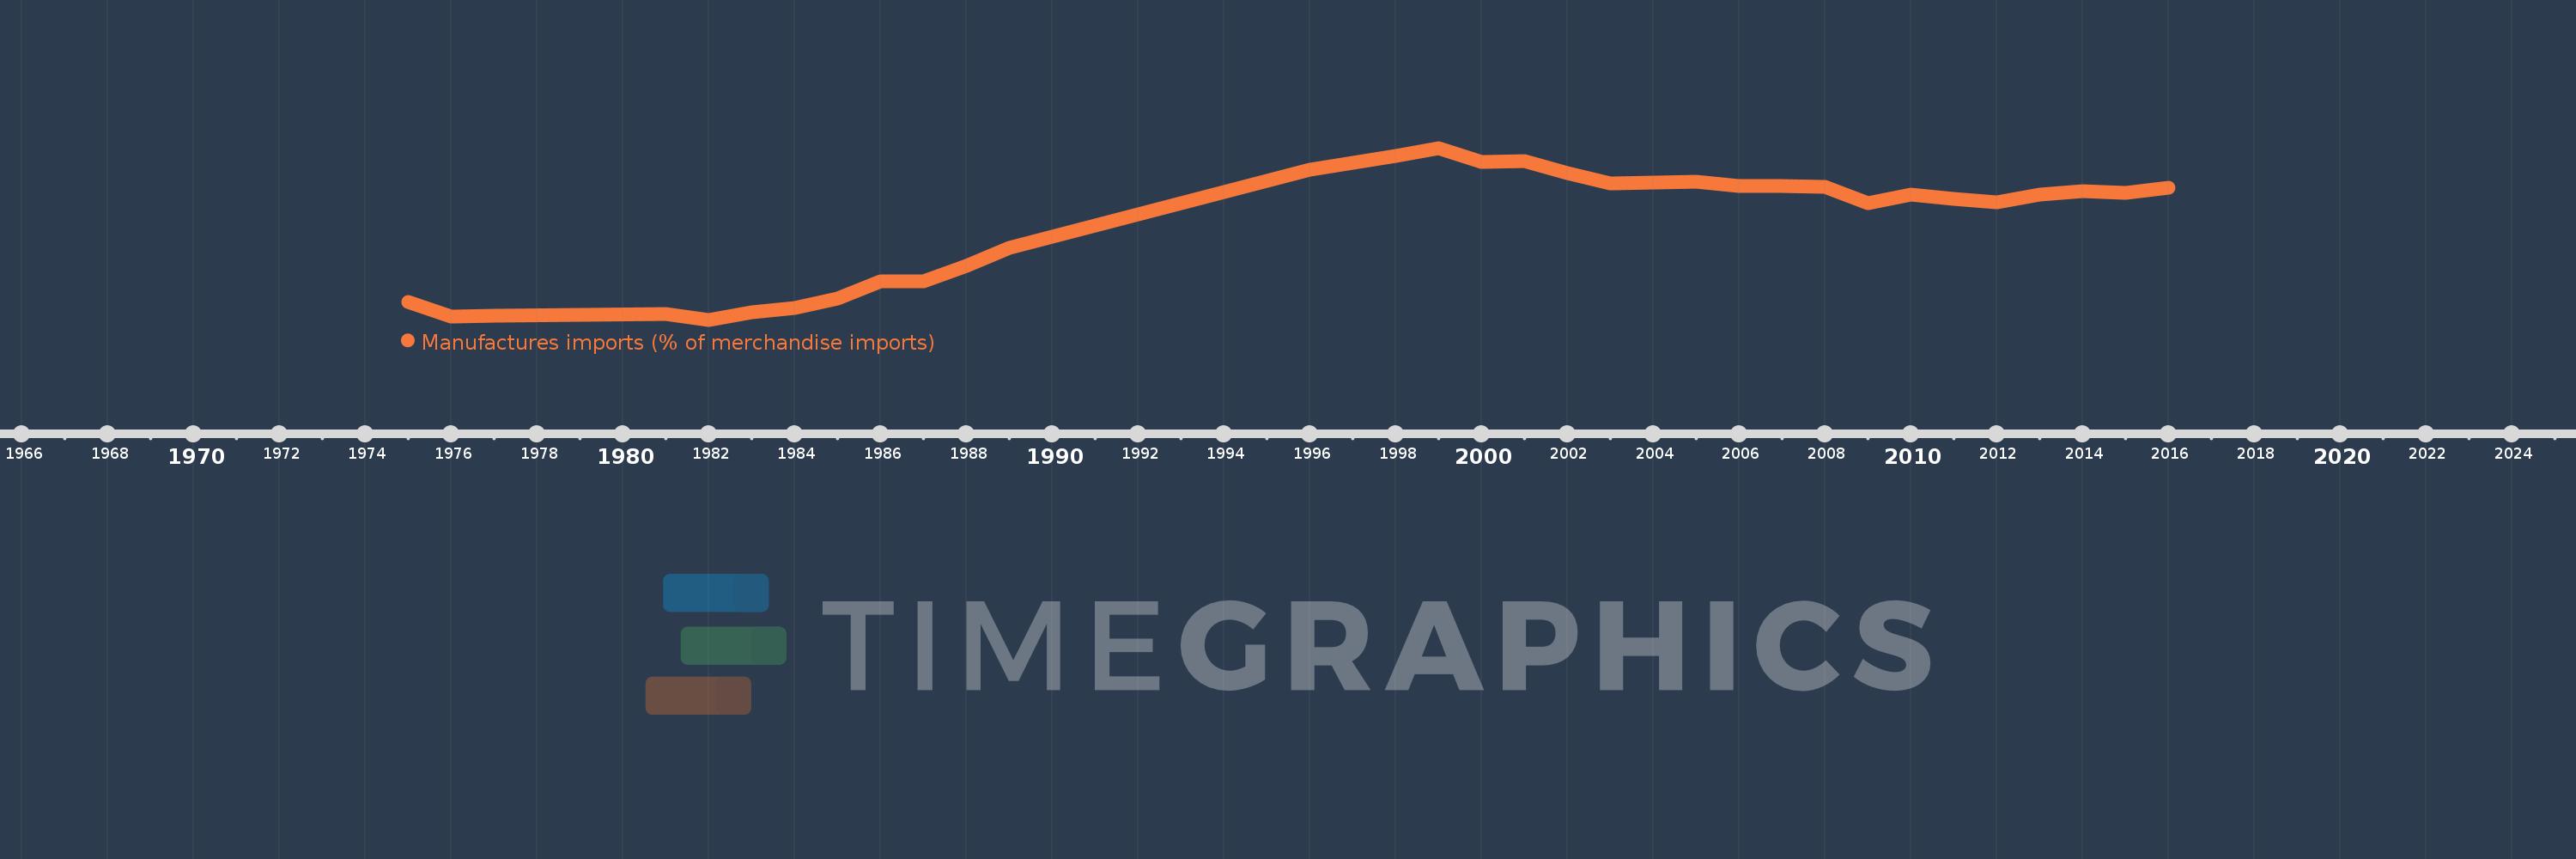
Manufactures imports (% of merchandise imports)
2016,2015,2014,2013,2012,2011,2010,2009,2008,2007,2006,2005,2004,2003,2002,2001,2000,1999,1998,1996,1989,1988,1987,1986,1985,1984,1983,1982,1981,1977,1976,1975
This statistics in other country:
AfghanistanAlbaniaAlgeriaAndorraAngolaAntigua and BarbudaArab WorldArgentinaArmeniaArubaAustraliaAustriaAzerbaijanBahamas, TheBahrainBangladeshBarbadosBelarusBelgiumBelizeBeninBermudaBhutanBoliviaBosnia and HerzegovinaBotswanaBrazilBrunei DarussalamBulgariaBurkina FasoBurundiCabo VerdeCambodiaCameroonCanadaCaribbean small statesCayman IslandsCentral African RepublicCentral Europe and the BalticsChadChileChinaColombiaComorosCongo, Dem. Rep.Congo, Rep.Costa RicaCote d'IvoireCroatiaCubaCyprusCzech RepublicDenmarkDjiboutiDominicaDominican RepublicEarly-demographic dividendEast Asia & PacificEast Asia & Pacific (excluding high income)East Asia & Pacific (IDA & IBRD countries)EcuadorEgypt, Arab Rep.El SalvadorEquatorial GuineaEritreaEstoniaEthiopiaEuro areaEurope & Central AsiaEurope & Central Asia (excluding high income)Europe & Central Asia (IDA & IBRD countries)European UnionFaroe IslandsFijiFinlandFragile and conflict affected situationsFranceFrench PolynesiaGabonGambia, TheGeorgiaGermanyGhanaGreeceGreenlandGrenadaGuatemalaGuineaGuinea-BissauGuyanaHaitiHeavily indebted poor countries (HIPC)High incomeHondurasHong Kong SAR, ChinaHungaryIBRD onlyIcelandIDA & IBRD totalIDA blendIDA onlyIDA totalIndiaIndonesiaIran, Islamic Rep.IraqIrelandIsraelItalyJamaicaJapanJordanKazakhstanKenyaKiribatiKorea, Rep.KuwaitKyrgyz RepublicLao PDRLate-demographic dividendLatin America & Caribbean Latin America & Caribbean (excluding high income)Latin America & the Caribbean (IDA & IBRD countries)LatviaLeast developed countries: UN classificationLebanonLesothoLiberiaLibyaLithuaniaLow & middle incomeLow incomeLower middle incomeLuxembourgMacao SAR, ChinaMacedonia, FYRMadagascarMalawiMalaysiaMaldivesMaliMaltaMauritaniaMauritiusMexicoMiddle East & North AfricaMiddle East & North Africa (excluding high income)Middle East & North Africa (IDA & IBRD countries)Middle incomeMoldovaMongoliaMoroccoMozambiqueMyanmarNamibiaNepalNetherlandsNew CaledoniaNew ZealandNicaraguaNigerNigeriaNorth AmericaNorwayOECD membersOmanOther small statesPacific island small statesPakistanPalauPanamaPapua New GuineaParaguayPeruPhilippinesPolandPortugalPost-demographic dividendPre-demographic dividendQatarRomaniaRussian FederationRwandaSamoaSao Tome and PrincipeSaudi ArabiaSenegalSerbiaSeychellesSierra LeoneSingaporeSlovak RepublicSloveniaSmall statesSolomon IslandsSomaliaSouth AfricaSouth AsiaSouth Asia (IDA & IBRD)SpainSri LankaSt. Kitts and NevisSt. LuciaSt. Vincent and the GrenadinesSub-Saharan Africa Sub-Saharan Africa (excluding high income)Sub-Saharan Africa (IDA & IBRD countries)SudanSurinameSwazilandSwedenSwitzerlandSyrian Arab RepublicTajikistanTanzaniaThailandTimor-LesteTogoTongaTrinidad and TobagoTunisiaTurkeyTurkmenistanTurks and Caicos IslandsTuvaluUgandaUkraineUnited Arab EmiratesUnited KingdomUnited StatesUpper middle incomeUruguayVanuatuVenezuela, RBVietnamVirgin Islands (U.S.)WorldYemen, Rep.ZambiaZimbabwe Timeline:
This timeline shows a graph from 1975 to 2016 of Bahamas, The. No data until 1974. Number of actual observations by date: 32.
Source name:
World Development Indicators
Source organization:
World Bank staff estimates from the Comtrade database maintained by the United Nations Statistics Division.
Categories, topics:
Private Sector, Trade
Last updated:
apr 23, 2017
Indicators value changes by year
Maximum:
73.162
jan 1, 1999
At the date of observation
Value
Absolute change
Change from previous value
jan 1, 1975
11.591
+11.591
0.0%
jan 1, 1976
5.64
-5.951
-51.35%
jan 1, 1977
6.033
+0.393
6.97%
jan 1, 1981
6.704
+0.672
11.13%
jan 1, 1982
4.321
-2.383
-35.55%
jan 1, 1983
7.387
+3.066
70.97%
jan 1, 1984
9.084
+1.697
22.97%
jan 1, 1985
12.73
+3.646
40.14%
jan 1, 1986
19.694
+6.963
54.7%
jan 1, 1987
19.725
+0.032
0.16%
jan 1, 1988
25.794
+6.069
30.77%
jan 1, 1989
33.008
+7.214
27.97%
jan 1, 1996
64.597
+31.589
95.7%
jan 1, 1998
69.995
+5.399
8.36%
jan 1, 1999
73.162
+3.167
4.53%
jan 1, 2000
67.697
-5.466
-7.47%
jan 1, 2001
67.837
+0.14
0.21%
jan 1, 2002
63.218
-4.618
-6.81%
jan 1, 2003
58.901
-4.317
-6.83%
jan 1, 2004
59.28
+0.379
0.64%
jan 1, 2005
59.776
+0.496
0.84%
jan 1, 2006
57.851
-1.925
-3.22%
jan 1, 2007
57.798
-0.053
-0.09%
jan 1, 2008
57.678
-0.12
-0.21%
jan 1, 2009
51.062
-6.617
-11.47%
jan 1, 2010
54.468
+3.406
6.67%
jan 1, 2011
52.905
-1.562
-2.87%
jan 1, 2012
51.225
-1.68
-3.18%
jan 1, 2013
54.325
+3.1
6.05%
jan 1, 2014
56.004
+1.678
3.09%
jan 1, 2015
54.995
-1.008
-1.8%
jan 1, 2016
57.345
+2.35
4.27%
Ranking of countries by current statistics by years


Comments: