29
/
en
AIzaSyAYiBZKx7MnpbEhh9jyipgxe19OcubqV5w
April 1, 2024
131530
Faroe Islands
FRO
true
2
1
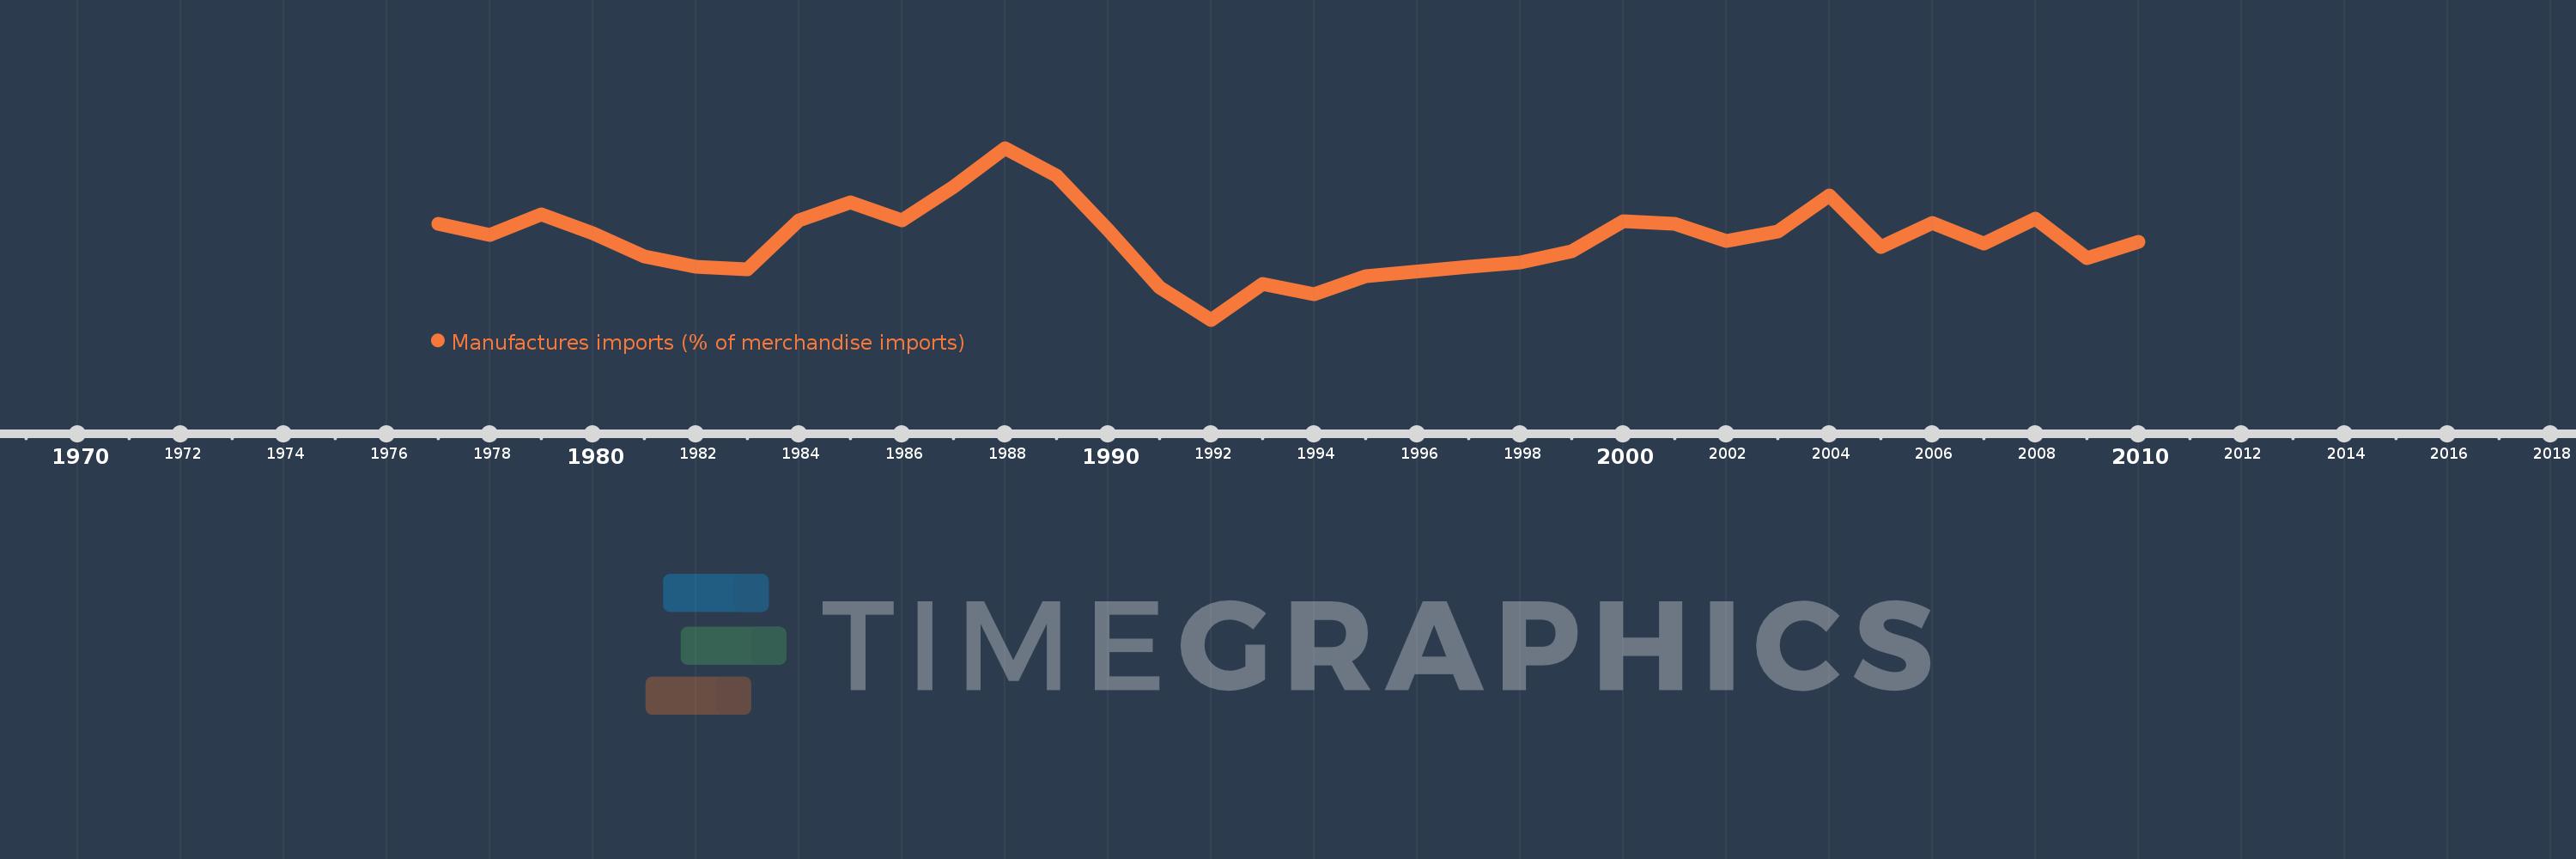
Manufactures imports (% of merchandise imports)
2010,2009,2008,2007,2006,2005,2004,2003,2002,2001,2000,1999,1998,1997,1995,1994,1993,1992,1991,1990,1989,1988,1987,1986,1985,1984,1983,1982,1981,1980,1979,1978,1977
This statistics in other country:
AfghanistanAlbaniaAlgeriaAndorraAngolaAntigua and BarbudaArab WorldArgentinaArmeniaArubaAustraliaAustriaAzerbaijanBahamas, TheBahrainBangladeshBarbadosBelarusBelgiumBelizeBeninBermudaBhutanBoliviaBosnia and HerzegovinaBotswanaBrazilBrunei DarussalamBulgariaBurkina FasoBurundiCabo VerdeCambodiaCameroonCanadaCaribbean small statesCayman IslandsCentral African RepublicCentral Europe and the BalticsChadChileChinaColombiaComorosCongo, Dem. Rep.Congo, Rep.Costa RicaCote d'IvoireCroatiaCubaCyprusCzech RepublicDenmarkDjiboutiDominicaDominican RepublicEarly-demographic dividendEast Asia & PacificEast Asia & Pacific (excluding high income)East Asia & Pacific (IDA & IBRD countries)EcuadorEgypt, Arab Rep.El SalvadorEquatorial GuineaEritreaEstoniaEthiopiaEuro areaEurope & Central AsiaEurope & Central Asia (excluding high income)Europe & Central Asia (IDA & IBRD countries)European UnionFaroe IslandsFijiFinlandFragile and conflict affected situationsFranceFrench PolynesiaGabonGambia, TheGeorgiaGermanyGhanaGreeceGreenlandGrenadaGuatemalaGuineaGuinea-BissauGuyanaHaitiHeavily indebted poor countries (HIPC)High incomeHondurasHong Kong SAR, ChinaHungaryIBRD onlyIcelandIDA & IBRD totalIDA blendIDA onlyIDA totalIndiaIndonesiaIran, Islamic Rep.IraqIrelandIsraelItalyJamaicaJapanJordanKazakhstanKenyaKiribatiKorea, Rep.KuwaitKyrgyz RepublicLao PDRLate-demographic dividendLatin America & Caribbean Latin America & Caribbean (excluding high income)Latin America & the Caribbean (IDA & IBRD countries)LatviaLeast developed countries: UN classificationLebanonLesothoLiberiaLibyaLithuaniaLow & middle incomeLow incomeLower middle incomeLuxembourgMacao SAR, ChinaMacedonia, FYRMadagascarMalawiMalaysiaMaldivesMaliMaltaMauritaniaMauritiusMexicoMiddle East & North AfricaMiddle East & North Africa (excluding high income)Middle East & North Africa (IDA & IBRD countries)Middle incomeMoldovaMongoliaMoroccoMozambiqueMyanmarNamibiaNepalNetherlandsNew CaledoniaNew ZealandNicaraguaNigerNigeriaNorth AmericaNorwayOECD membersOmanOther small statesPacific island small statesPakistanPalauPanamaPapua New GuineaParaguayPeruPhilippinesPolandPortugalPost-demographic dividendPre-demographic dividendQatarRomaniaRussian FederationRwandaSamoaSao Tome and PrincipeSaudi ArabiaSenegalSerbiaSeychellesSierra LeoneSingaporeSlovak RepublicSloveniaSmall statesSolomon IslandsSomaliaSouth AfricaSouth AsiaSouth Asia (IDA & IBRD)SpainSri LankaSt. Kitts and NevisSt. LuciaSt. Vincent and the GrenadinesSub-Saharan Africa Sub-Saharan Africa (excluding high income)Sub-Saharan Africa (IDA & IBRD countries)SudanSurinameSwazilandSwedenSwitzerlandSyrian Arab RepublicTajikistanTanzaniaThailandTimor-LesteTogoTongaTrinidad and TobagoTunisiaTurkeyTurkmenistanTurks and Caicos IslandsTuvaluUgandaUkraineUnited Arab EmiratesUnited KingdomUnited StatesUpper middle incomeUruguayVanuatuVenezuela, RBVietnamVirgin Islands (U.S.)WorldYemen, Rep.ZambiaZimbabwe Timeline:
This timeline shows a graph from 1977 to 2010 of Faroe Islands. No data until 1976. Number of actual observations by date: 33.
Source name:
World Development Indicators
Source organization:
World Bank staff estimates from the Comtrade database maintained by the United Nations Statistics Division.
Categories, topics:
Private Sector, Trade
Last updated:
apr 23, 2017
Indicators value changes by year
Minimum:
48.231
jan 1, 1992
Maximum:
79.161
jan 1, 1988
At the date of observation
Value
Absolute change
Change from previous value
jan 1, 1977
65.448
+65.448
0.0%
jan 1, 1978
63.422
-2.026
-3.1%
jan 1, 1979
67.188
+3.765
5.94%
jan 1, 1980
63.783
-3.404
-5.07%
jan 1, 1981
59.654
-4.129
-6.47%
jan 1, 1982
57.749
-1.905
-3.19%
jan 1, 1983
57.248
-0.501
-0.87%
jan 1, 1984
66.153
+8.905
15.56%
jan 1, 1985
69.422
+3.268
4.94%
jan 1, 1986
66.148
-3.273
-4.72%
jan 1, 1987
72.159
+6.011
9.09%
jan 1, 1988
79.161
+7.001
9.7%
jan 1, 1989
74.09
-5.071
-6.41%
jan 1, 1990
64.407
-9.683
-13.07%
jan 1, 1991
54.087
-10.32
-16.02%
jan 1, 1992
48.231
-5.856
-10.83%
jan 1, 1993
54.74
+6.509
13.5%
jan 1, 1994
52.776
-1.964
-3.59%
jan 1, 1995
56.082
+3.306
6.26%
jan 1, 1997
57.839
+1.757
3.13%
jan 1, 1998
58.516
+0.677
1.17%
jan 1, 1999
60.614
+2.098
3.59%
jan 1, 2000
65.963
+5.349
8.83%
jan 1, 2001
65.469
-0.494
-0.75%
jan 1, 2002
62.469
-3.0
-4.58%
jan 1, 2003
64.11
+1.641
2.63%
jan 1, 2004
70.595
+6.486
10.12%
jan 1, 2005
61.254
-9.341
-13.23%
jan 1, 2006
65.589
+4.335
7.08%
jan 1, 2007
61.972
-3.617
-5.51%
jan 1, 2008
66.399
+4.426
7.14%
jan 1, 2009
59.285
-7.113
-10.71%
jan 1, 2010
62.271
+2.986
5.04%
Ranking of countries by current statistics by years


Comments: