29
/
en
AIzaSyAYiBZKx7MnpbEhh9jyipgxe19OcubqV5w
April 1, 2024
79493
Barbados
BRB
true
2
1
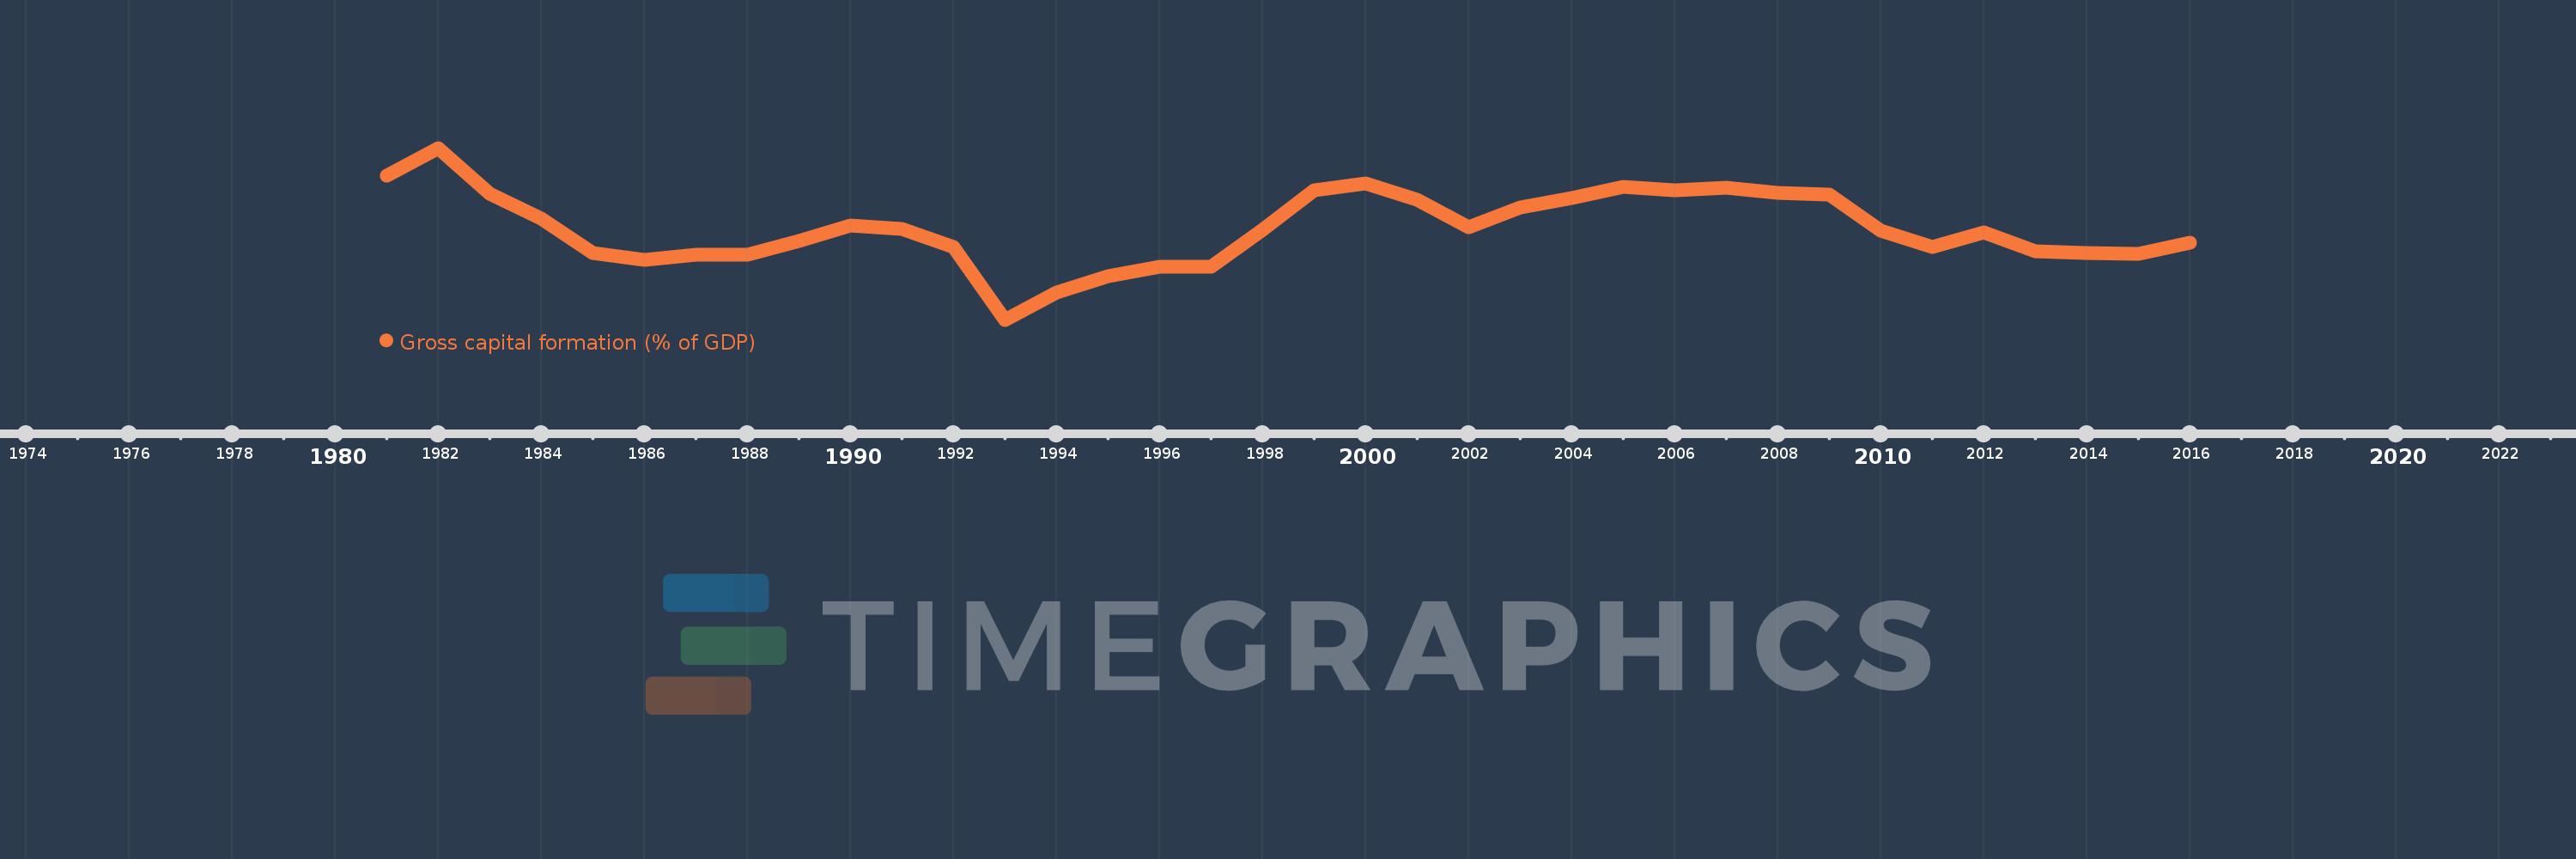
Gross capital formation (% of GDP)
2016,2015,2014,2013,2012,2011,2010,2009,2008,2007,2006,2005,2004,2003,2002,2001,2000,1999,1998,1997,1996,1995,1994,1993,1992,1991,1990,1989,1988,1987,1986,1985,1984,1983,1982,1981
This statistics in other country:
AfghanistanAlbaniaAlgeriaAngolaAntigua and BarbudaArab WorldArgentinaArmeniaArubaAustraliaAustriaAzerbaijanBahamas, TheBahrainBangladeshBarbadosBelarusBelgiumBelizeBeninBermudaBhutanBoliviaBosnia and HerzegovinaBotswanaBrazilBrunei DarussalamBulgariaBurkina FasoBurundiCabo VerdeCambodiaCameroonCanadaCaribbean small statesCentral African RepublicCentral Europe and the BalticsChadChileChinaColombiaComorosCongo, Dem. Rep.Congo, Rep.Costa RicaCote d'IvoireCroatiaCubaCyprusCzech RepublicDenmarkDjiboutiDominicaDominican RepublicEarly-demographic dividendEast Asia & PacificEast Asia & Pacific (excluding high income)East Asia & Pacific (IDA & IBRD countries)EcuadorEgypt, Arab Rep.El SalvadorEquatorial GuineaEritreaEstoniaEthiopiaEuro areaEurope & Central AsiaEurope & Central Asia (excluding high income)Europe & Central Asia (IDA & IBRD countries)European UnionFaroe IslandsFijiFinlandFragile and conflict affected situationsFranceGabonGambia, TheGeorgiaGermanyGhanaGreeceGrenadaGuatemalaGuineaGuinea-BissauGuyanaHaitiHeavily indebted poor countries (HIPC)High incomeHondurasHong Kong SAR, ChinaHungaryIBRD onlyIcelandIDA & IBRD totalIDA blendIDA onlyIDA totalIndiaIndonesiaIran, Islamic Rep.IraqIrelandIsraelItalyJamaicaJapanJordanKazakhstanKenyaKiribatiKorea, Rep.KosovoKuwaitKyrgyz RepublicLao PDRLate-demographic dividendLatin America & Caribbean Latin America & Caribbean (excluding high income)Latin America & the Caribbean (IDA & IBRD countries)LatviaLeast developed countries: UN classificationLebanonLesothoLiberiaLibyaLithuaniaLow & middle incomeLow incomeLower middle incomeLuxembourgMacao SAR, ChinaMacedonia, FYRMadagascarMalawiMalaysiaMaldivesMaliMaltaMauritaniaMauritiusMexicoMicronesia, Fed. Sts.Middle East & North AfricaMiddle East & North Africa (excluding high income)Middle East & North Africa (IDA & IBRD countries)Middle incomeMoldovaMongoliaMontenegroMoroccoMozambiqueNamibiaNepalNetherlandsNew CaledoniaNew ZealandNicaraguaNigerNigeriaNorth AmericaNorwayOECD membersOmanOther small statesPacific island small statesPakistanPanamaPapua New GuineaParaguayPeruPhilippinesPolandPortugalPost-demographic dividendPre-demographic dividendPuerto RicoQatarRomaniaRussian FederationRwandaSaudi ArabiaSenegalSerbiaSeychellesSierra LeoneSingaporeSlovak RepublicSloveniaSmall statesSolomon IslandsSomaliaSouth AfricaSouth AsiaSouth Asia (IDA & IBRD)South SudanSpainSri LankaSt. Kitts and NevisSt. LuciaSt. Vincent and the GrenadinesSub-Saharan Africa Sub-Saharan Africa (excluding high income)Sub-Saharan Africa (IDA & IBRD countries)SudanSurinameSwazilandSwedenSwitzerlandSyrian Arab RepublicTajikistanTanzaniaThailandTimor-LesteTogoTongaTrinidad and TobagoTunisiaTurkeyTurkmenistanUgandaUkraineUnited Arab EmiratesUnited KingdomUnited StatesUpper middle incomeUruguayUzbekistanVanuatuVenezuela, RBVietnamWest Bank and GazaWorldYemen, Rep.ZambiaZimbabwe Timeline:
This timeline shows a graph from 1981 to 2016 of Barbados. No data until 1980. Number of actual observations by date: 36.
Source name:
World Development Indicators
Source organization:
World Bank national accounts data, and OECD National Accounts data files.
Categories, topics:
Economy & Growth
Last updated:
apr 23, 2017
Indicators value changes by year
Maximum:
22.256
jan 1, 1982
At the date of observation
Value
Absolute change
Change from previous value
jan 1, 1981
19.854
+19.854
0.0%
jan 1, 1982
22.256
+2.401
12.09%
jan 1, 1983
18.256
-3.999
-17.97%
jan 1, 1984
16.098
-2.158
-11.82%
jan 1, 1985
13.089
-3.009
-18.69%
jan 1, 1986
12.46
-0.629
-4.8%
jan 1, 1987
12.933
+0.473
3.79%
jan 1, 1988
12.933
0.0
0.0%
jan 1, 1989
14.155
+1.223
9.45%
jan 1, 1990
15.452
+1.296
9.16%
jan 1, 1991
15.201
-0.251
-1.62%
jan 1, 1992
13.592
-1.609
-10.58%
jan 1, 1993
7.231
-6.361
-46.8%
jan 1, 1994
9.619
+2.388
33.03%
jan 1, 1995
11.077
+1.458
15.16%
jan 1, 1996
11.856
+0.779
7.03%
jan 1, 1997
11.87
+0.014
0.12%
jan 1, 1998
15.107
+3.237
27.27%
jan 1, 1999
18.539
+3.432
22.72%
jan 1, 2000
19.123
+0.584
3.15%
jan 1, 2001
17.747
-1.376
-7.2%
jan 1, 2002
15.315
-2.433
-13.71%
jan 1, 2003
17.056
+1.741
11.37%
jan 1, 2004
17.9
+0.844
4.95%
jan 1, 2005
18.854
+0.954
5.33%
jan 1, 2006
18.54
-0.314
-1.66%
jan 1, 2007
18.778
+0.237
1.28%
jan 1, 2008
18.339
-0.439
-2.34%
jan 1, 2009
18.205
-0.134
-0.73%
jan 1, 2010
15.016
-3.188
-17.51%
jan 1, 2011
13.564
-1.453
-9.67%
jan 1, 2012
14.864
+1.3
9.58%
jan 1, 2013
13.232
-1.632
-10.98%
jan 1, 2014
13.032
-0.2
-1.51%
jan 1, 2015
13.014
-0.018
-0.14%
jan 1, 2016
13.988
+0.974
7.49%
Ranking of countries by current statistics by years


Comments: