29
/
en
AIzaSyAYiBZKx7MnpbEhh9jyipgxe19OcubqV5w
April 1, 2024
248756
Sri Lanka
LKA
true
2
1
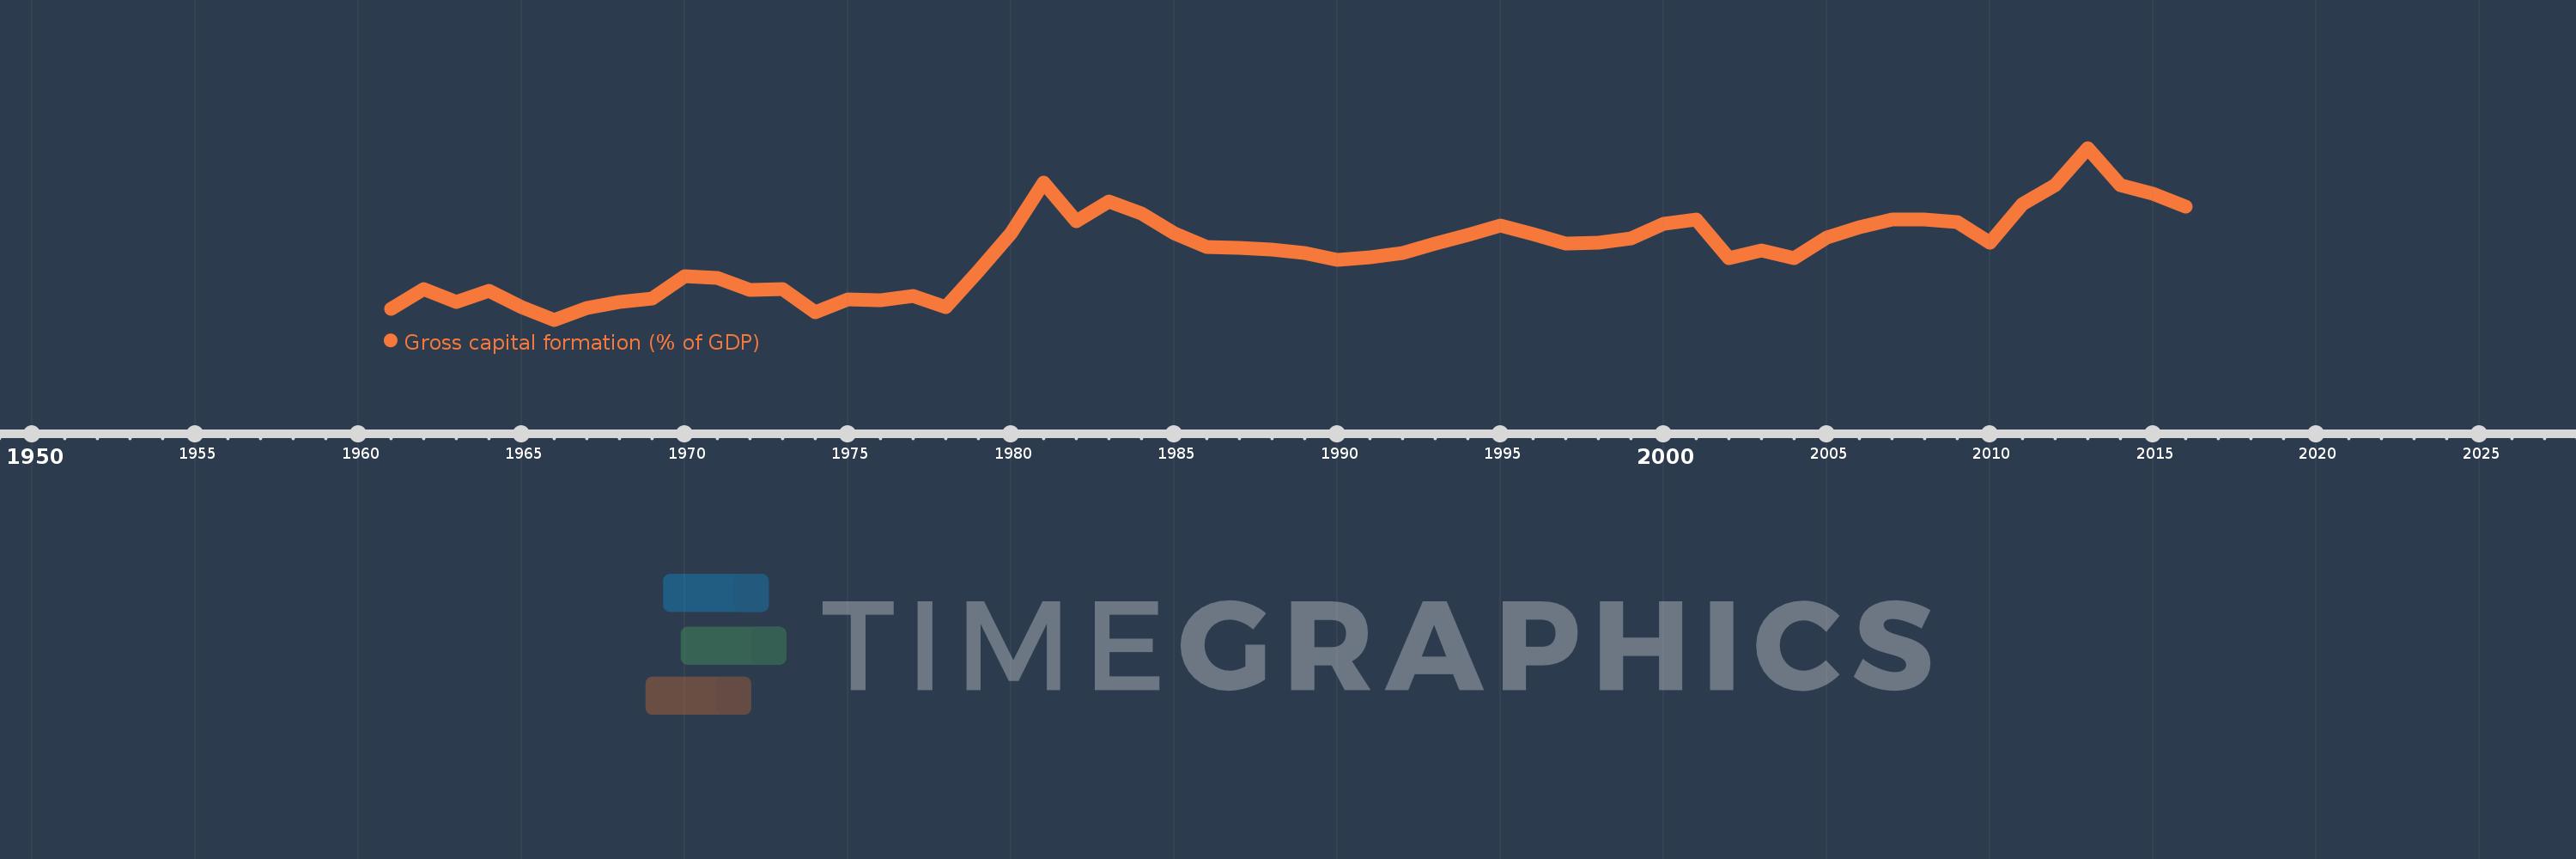
Gross capital formation (% of GDP)
2016,2015,2014,2013,2012,2011,2010,2009,2008,2007,2006,2005,2004,2003,2002,2001,2000,1999,1998,1997,1996,1995,1994,1993,1992,1991,1990,1989,1988,1987,1986,1985,1984,1983,1982,1981,1980,1979,1978,1977,1976,1975,1974,1973,1972,1971,1970,1969,1968,1967,1966,1965,1964,1963,1962,1961
This statistics in other country:
AfghanistanAlbaniaAlgeriaAngolaAntigua and BarbudaArab WorldArgentinaArmeniaArubaAustraliaAustriaAzerbaijanBahamas, TheBahrainBangladeshBarbadosBelarusBelgiumBelizeBeninBermudaBhutanBoliviaBosnia and HerzegovinaBotswanaBrazilBrunei DarussalamBulgariaBurkina FasoBurundiCabo VerdeCambodiaCameroonCanadaCaribbean small statesCentral African RepublicCentral Europe and the BalticsChadChileChinaColombiaComorosCongo, Dem. Rep.Congo, Rep.Costa RicaCote d'IvoireCroatiaCubaCyprusCzech RepublicDenmarkDjiboutiDominicaDominican RepublicEarly-demographic dividendEast Asia & PacificEast Asia & Pacific (excluding high income)East Asia & Pacific (IDA & IBRD countries)EcuadorEgypt, Arab Rep.El SalvadorEquatorial GuineaEritreaEstoniaEthiopiaEuro areaEurope & Central AsiaEurope & Central Asia (excluding high income)Europe & Central Asia (IDA & IBRD countries)European UnionFaroe IslandsFijiFinlandFragile and conflict affected situationsFranceGabonGambia, TheGeorgiaGermanyGhanaGreeceGrenadaGuatemalaGuineaGuinea-BissauGuyanaHaitiHeavily indebted poor countries (HIPC)High incomeHondurasHong Kong SAR, ChinaHungaryIBRD onlyIcelandIDA & IBRD totalIDA blendIDA onlyIDA totalIndiaIndonesiaIran, Islamic Rep.IraqIrelandIsraelItalyJamaicaJapanJordanKazakhstanKenyaKiribatiKorea, Rep.KosovoKuwaitKyrgyz RepublicLao PDRLate-demographic dividendLatin America & Caribbean Latin America & Caribbean (excluding high income)Latin America & the Caribbean (IDA & IBRD countries)LatviaLeast developed countries: UN classificationLebanonLesothoLiberiaLibyaLithuaniaLow & middle incomeLow incomeLower middle incomeLuxembourgMacao SAR, ChinaMacedonia, FYRMadagascarMalawiMalaysiaMaldivesMaliMaltaMauritaniaMauritiusMexicoMicronesia, Fed. Sts.Middle East & North AfricaMiddle East & North Africa (excluding high income)Middle East & North Africa (IDA & IBRD countries)Middle incomeMoldovaMongoliaMontenegroMoroccoMozambiqueNamibiaNepalNetherlandsNew CaledoniaNew ZealandNicaraguaNigerNigeriaNorth AmericaNorwayOECD membersOmanOther small statesPacific island small statesPakistanPanamaPapua New GuineaParaguayPeruPhilippinesPolandPortugalPost-demographic dividendPre-demographic dividendPuerto RicoQatarRomaniaRussian FederationRwandaSaudi ArabiaSenegalSerbiaSeychellesSierra LeoneSingaporeSlovak RepublicSloveniaSmall statesSolomon IslandsSomaliaSouth AfricaSouth AsiaSouth Asia (IDA & IBRD)South SudanSpainSri LankaSt. Kitts and NevisSt. LuciaSt. Vincent and the GrenadinesSub-Saharan Africa Sub-Saharan Africa (excluding high income)Sub-Saharan Africa (IDA & IBRD countries)SudanSurinameSwazilandSwedenSwitzerlandSyrian Arab RepublicTajikistanTanzaniaThailandTimor-LesteTogoTongaTrinidad and TobagoTunisiaTurkeyTurkmenistanUgandaUkraineUnited Arab EmiratesUnited KingdomUnited StatesUpper middle incomeUruguayUzbekistanVanuatuVenezuela, RBVietnamWest Bank and GazaWorldYemen, Rep.ZambiaZimbabwe Timeline:
This timeline shows a graph from 1961 to 2016 of Sri Lanka. No data until 1960. Number of actual observations by date: 56.
Source name:
World Development Indicators
Source organization:
World Bank national accounts data, and OECD National Accounts data files.
Categories, topics:
Economy & Growth
Last updated:
apr 23, 2017
Indicators value changes by year
Minimum:
12.531
jan 1, 1966
Maximum:
39.056
jan 1, 2013
At the date of observation
Value
Absolute change
Change from previous value
jan 1, 1961
14.207
+14.207
0.0%
jan 1, 1962
17.291
+3.084
21.71%
jan 1, 1963
15.334
-1.957
-11.32%
jan 1, 1964
17.005
+1.671
10.89%
jan 1, 1965
14.444
-2.561
-15.06%
jan 1, 1966
12.531
-1.913
-13.24%
jan 1, 1967
14.334
+1.803
14.39%
jan 1, 1968
15.237
+0.904
6.3%
jan 1, 1969
15.852
+0.614
4.03%
jan 1, 1970
19.273
+3.421
21.58%
jan 1, 1971
18.948
-0.326
-1.69%
jan 1, 1972
17.068
-1.88
-9.92%
jan 1, 1973
17.302
+0.234
1.37%
jan 1, 1974
13.736
-3.566
-20.61%
jan 1, 1975
15.712
+1.976
14.39%
jan 1, 1976
15.577
-0.135
-0.86%
jan 1, 1977
16.21
+0.633
4.06%
jan 1, 1978
14.445
-1.765
-10.89%
jan 1, 1979
20.049
+5.604
38.8%
jan 1, 1980
25.821
+5.772
28.79%
jan 1, 1981
33.768
+7.947
30.78%
jan 1, 1982
27.775
-5.993
-17.75%
jan 1, 1983
30.761
+2.987
10.75%
jan 1, 1984
28.891
-1.87
-6.08%
jan 1, 1985
25.827
-3.064
-10.61%
jan 1, 1986
23.823
-2.004
-7.76%
jan 1, 1987
23.66
-0.163
-0.68%
jan 1, 1988
23.332
-0.327
-1.38%
jan 1, 1989
22.778
-0.555
-2.38%
jan 1, 1990
21.724
-1.053
-4.62%
jan 1, 1991
22.206
+0.481
2.22%
jan 1, 1992
22.87
+0.664
2.99%
jan 1, 1993
24.275
+1.405
6.14%
jan 1, 1994
25.557
+1.282
5.28%
jan 1, 1995
27.027
+1.47
5.75%
jan 1, 1996
25.731
-1.296
-4.8%
jan 1, 1997
24.249
-1.482
-5.76%
jan 1, 1998
24.386
+0.137
0.57%
jan 1, 1999
25.137
+0.751
3.08%
jan 1, 2000
27.291
+2.154
8.57%
jan 1, 2001
28.039
+0.749
2.74%
jan 1, 2002
22.004
-6.035
-21.52%
jan 1, 2003
23.289
+1.285
5.84%
jan 1, 2004
22.02
-1.269
-5.45%
jan 1, 2005
25.254
+3.233
14.68%
jan 1, 2006
26.827
+1.574
6.23%
jan 1, 2007
27.98
+1.152
4.3%
jan 1, 2008
27.952
-0.028
-0.1%
jan 1, 2009
27.552
-0.4
-1.43%
jan 1, 2010
24.434
-3.119
-11.32%
jan 1, 2011
30.352
+5.919
24.22%
jan 1, 2012
33.364
+3.011
9.92%
jan 1, 2013
39.056
+5.692
17.06%
jan 1, 2014
33.249
-5.806
-14.87%
jan 1, 2015
31.978
-1.272
-3.83%
jan 1, 2016
30.059
-1.919
-6.0%
Ranking of countries by current statistics by years


Comments: