29
/
en
AIzaSyAYiBZKx7MnpbEhh9jyipgxe19OcubqV5w
April 1, 2024
52640
OECD members
OED
false
2
1
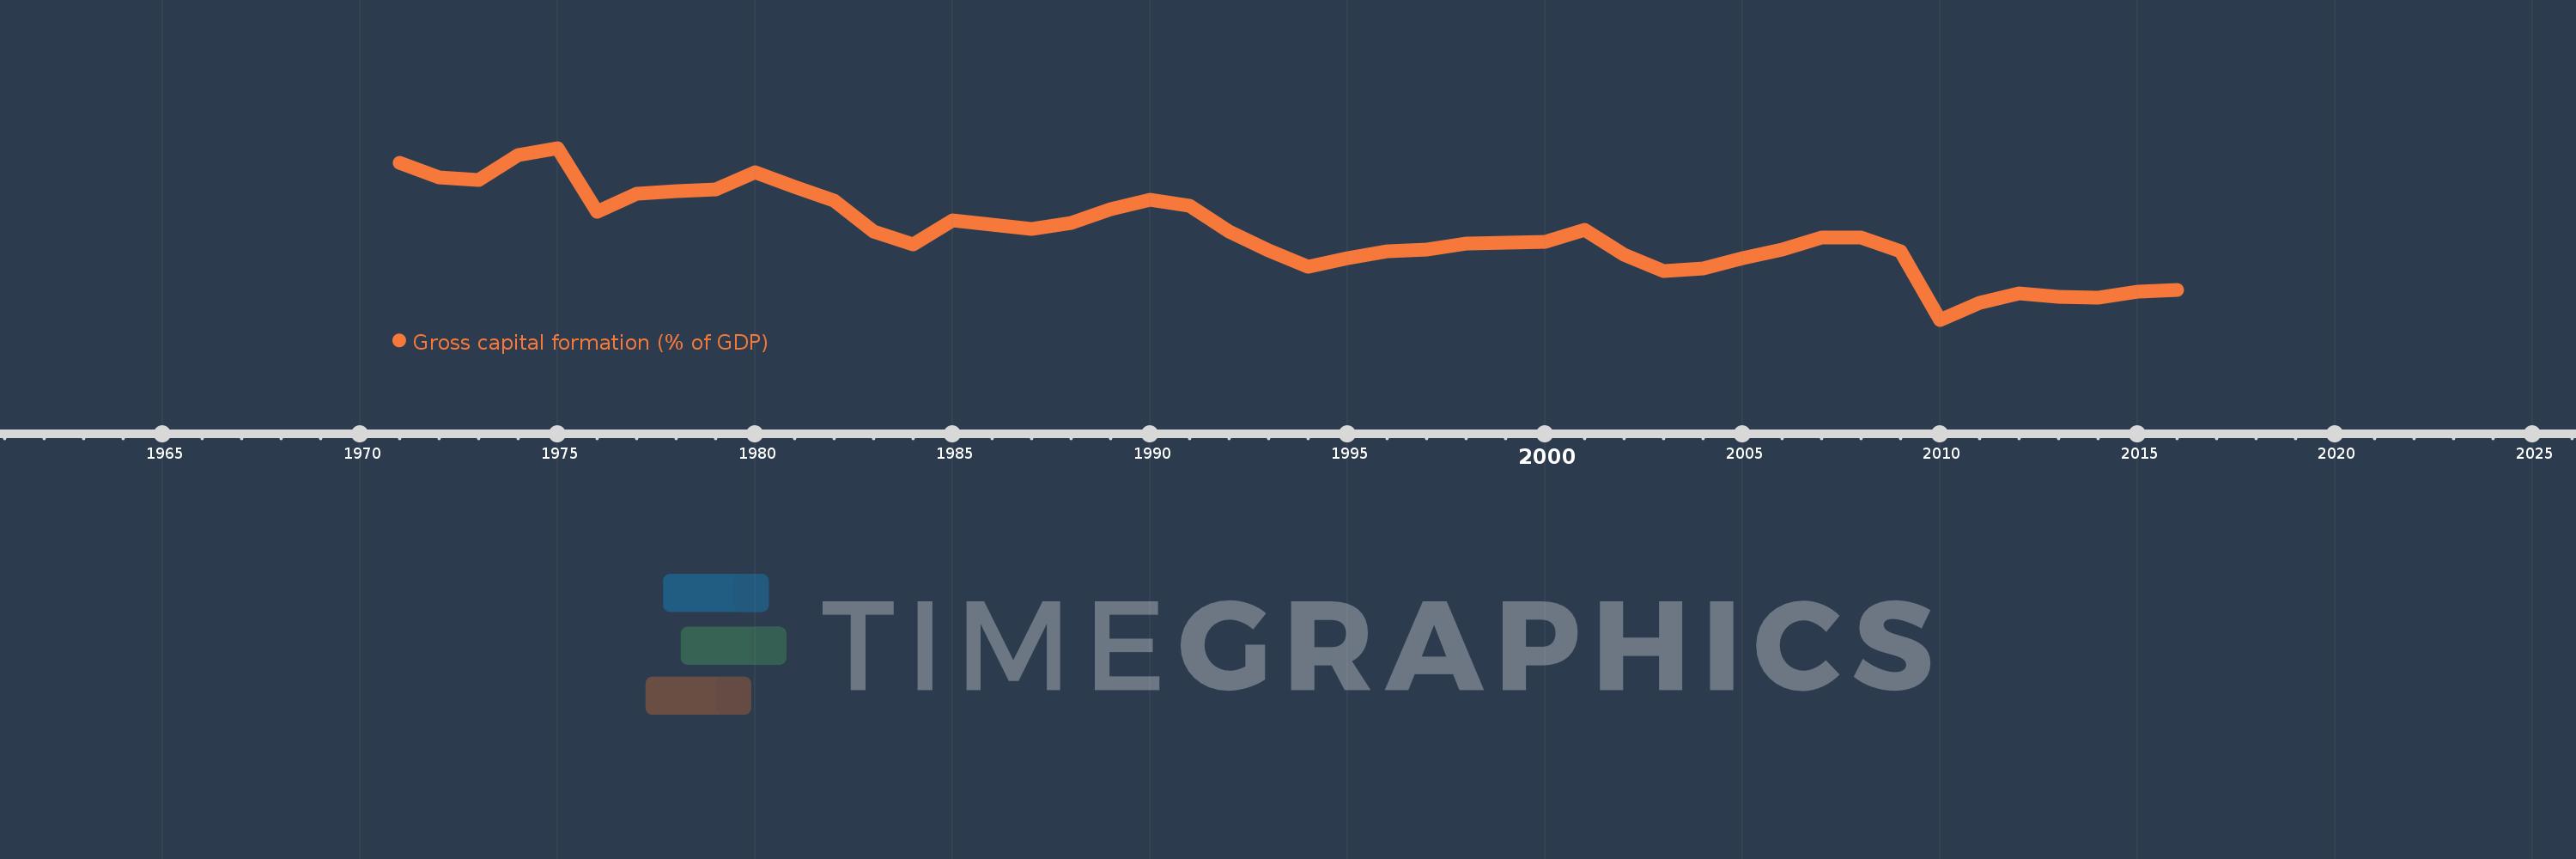
Gross capital formation (% of GDP)
2016,2015,2014,2013,2012,2011,2010,2009,2008,2007,2006,2005,2004,2003,2002,2001,2000,1999,1998,1997,1996,1995,1994,1993,1992,1991,1990,1989,1988,1987,1986,1985,1984,1983,1982,1981,1980,1979,1978,1977,1976,1975,1974,1973,1972,1971
This statistics in other country:
AfghanistanAlbaniaAlgeriaAngolaAntigua and BarbudaArab WorldArgentinaArmeniaArubaAustraliaAustriaAzerbaijanBahamas, TheBahrainBangladeshBarbadosBelarusBelgiumBelizeBeninBermudaBhutanBoliviaBosnia and HerzegovinaBotswanaBrazilBrunei DarussalamBulgariaBurkina FasoBurundiCabo VerdeCambodiaCameroonCanadaCaribbean small statesCentral African RepublicCentral Europe and the BalticsChadChileChinaColombiaComorosCongo, Dem. Rep.Congo, Rep.Costa RicaCote d'IvoireCroatiaCubaCyprusCzech RepublicDenmarkDjiboutiDominicaDominican RepublicEarly-demographic dividendEast Asia & PacificEast Asia & Pacific (excluding high income)East Asia & Pacific (IDA & IBRD countries)EcuadorEgypt, Arab Rep.El SalvadorEquatorial GuineaEritreaEstoniaEthiopiaEuro areaEurope & Central AsiaEurope & Central Asia (excluding high income)Europe & Central Asia (IDA & IBRD countries)European UnionFaroe IslandsFijiFinlandFragile and conflict affected situationsFranceGabonGambia, TheGeorgiaGermanyGhanaGreeceGrenadaGuatemalaGuineaGuinea-BissauGuyanaHaitiHeavily indebted poor countries (HIPC)High incomeHondurasHong Kong SAR, ChinaHungaryIBRD onlyIcelandIDA & IBRD totalIDA blendIDA onlyIDA totalIndiaIndonesiaIran, Islamic Rep.IraqIrelandIsraelItalyJamaicaJapanJordanKazakhstanKenyaKiribatiKorea, Rep.KosovoKuwaitKyrgyz RepublicLao PDRLate-demographic dividendLatin America & Caribbean Latin America & Caribbean (excluding high income)Latin America & the Caribbean (IDA & IBRD countries)LatviaLeast developed countries: UN classificationLebanonLesothoLiberiaLibyaLithuaniaLow & middle incomeLow incomeLower middle incomeLuxembourgMacao SAR, ChinaMacedonia, FYRMadagascarMalawiMalaysiaMaldivesMaliMaltaMauritaniaMauritiusMexicoMicronesia, Fed. Sts.Middle East & North AfricaMiddle East & North Africa (excluding high income)Middle East & North Africa (IDA & IBRD countries)Middle incomeMoldovaMongoliaMontenegroMoroccoMozambiqueNamibiaNepalNetherlandsNew CaledoniaNew ZealandNicaraguaNigerNigeriaNorth AmericaNorwayOECD membersOmanOther small statesPacific island small statesPakistanPanamaPapua New GuineaParaguayPeruPhilippinesPolandPortugalPost-demographic dividendPre-demographic dividendPuerto RicoQatarRomaniaRussian FederationRwandaSaudi ArabiaSenegalSerbiaSeychellesSierra LeoneSingaporeSlovak RepublicSloveniaSmall statesSolomon IslandsSomaliaSouth AfricaSouth AsiaSouth Asia (IDA & IBRD)South SudanSpainSri LankaSt. Kitts and NevisSt. LuciaSt. Vincent and the GrenadinesSub-Saharan Africa Sub-Saharan Africa (excluding high income)Sub-Saharan Africa (IDA & IBRD countries)SudanSurinameSwazilandSwedenSwitzerlandSyrian Arab RepublicTajikistanTanzaniaThailandTimor-LesteTogoTongaTrinidad and TobagoTunisiaTurkeyTurkmenistanUgandaUkraineUnited Arab EmiratesUnited KingdomUnited StatesUpper middle incomeUruguayUzbekistanVanuatuVenezuela, RBVietnamWest Bank and GazaWorldYemen, Rep.ZambiaZimbabwe Timeline:
This timeline shows a graph from 1971 to 2016 of OECD members. No data until 1970. Number of actual observations by date: 46.
Source name:
World Development Indicators
Source organization:
World Bank national accounts data, and OECD National Accounts data files.
Categories, topics:
Economy & Growth
Last updated:
apr 23, 2017
Indicators value changes by year
Minimum:
19.534
jan 1, 2010
At the date of observation
Value
Absolute change
Change from previous value
jan 1, 1971
26.692
+26.692
0.0%
jan 1, 1972
25.991
-0.701
-2.63%
jan 1, 1973
25.905
-0.086
-0.33%
jan 1, 1974
27.019
+1.114
4.3%
jan 1, 1975
27.35
+0.33
1.22%
jan 1, 1976
24.432
-2.918
-10.67%
jan 1, 1977
25.283
+0.851
3.48%
jan 1, 1978
25.377
+0.094
0.37%
jan 1, 1979
25.452
+0.075
0.3%
jan 1, 1980
26.235
+0.783
3.08%
jan 1, 1981
25.58
-0.654
-2.49%
jan 1, 1982
24.937
-0.644
-2.52%
jan 1, 1983
23.539
-1.398
-5.61%
jan 1, 1984
22.951
-0.588
-2.5%
jan 1, 1985
24.075
+1.124
4.9%
jan 1, 1986
23.86
-0.216
-0.9%
jan 1, 1987
23.683
-0.176
-0.74%
jan 1, 1988
23.931
+0.247
1.04%
jan 1, 1989
24.58
+0.649
2.71%
jan 1, 1990
25.003
+0.423
1.72%
jan 1, 1991
24.701
-0.302
-1.21%
jan 1, 1992
23.532
-1.169
-4.73%
jan 1, 1993
22.7
-0.831
-3.53%
jan 1, 1994
21.959
-0.741
-3.26%
jan 1, 1995
22.346
+0.386
1.76%
jan 1, 1996
22.634
+0.288
1.29%
jan 1, 1997
22.745
+0.112
0.49%
jan 1, 1998
23.003
+0.258
1.13%
jan 1, 1999
23.025
+0.021
0.09%
jan 1, 2000
23.093
+0.068
0.3%
jan 1, 2001
23.623
+0.53
2.29%
jan 1, 2002
22.489
-1.135
-4.8%
jan 1, 2003
21.758
-0.731
-3.25%
jan 1, 2004
21.854
+0.097
0.44%
jan 1, 2005
22.326
+0.472
2.16%
jan 1, 2006
22.745
+0.419
1.88%
jan 1, 2007
23.266
+0.521
2.29%
jan 1, 2008
23.259
-0.007
-0.03%
jan 1, 2009
22.651
-0.607
-2.61%
jan 1, 2010
19.534
-3.117
-13.76%
jan 1, 2011
20.29
+0.756
3.87%
jan 1, 2012
20.738
+0.448
2.21%
jan 1, 2013
20.584
-0.153
-0.74%
jan 1, 2014
20.529
-0.056
-0.27%
jan 1, 2015
20.805
+0.276
1.35%
jan 1, 2016
20.886
+0.081
0.39%
Ranking of countries by current statistics by years


Comments: