29
/
en
AIzaSyAYiBZKx7MnpbEhh9jyipgxe19OcubqV5w
April 1, 2024
89846
Botswana
BWA
true
2
1
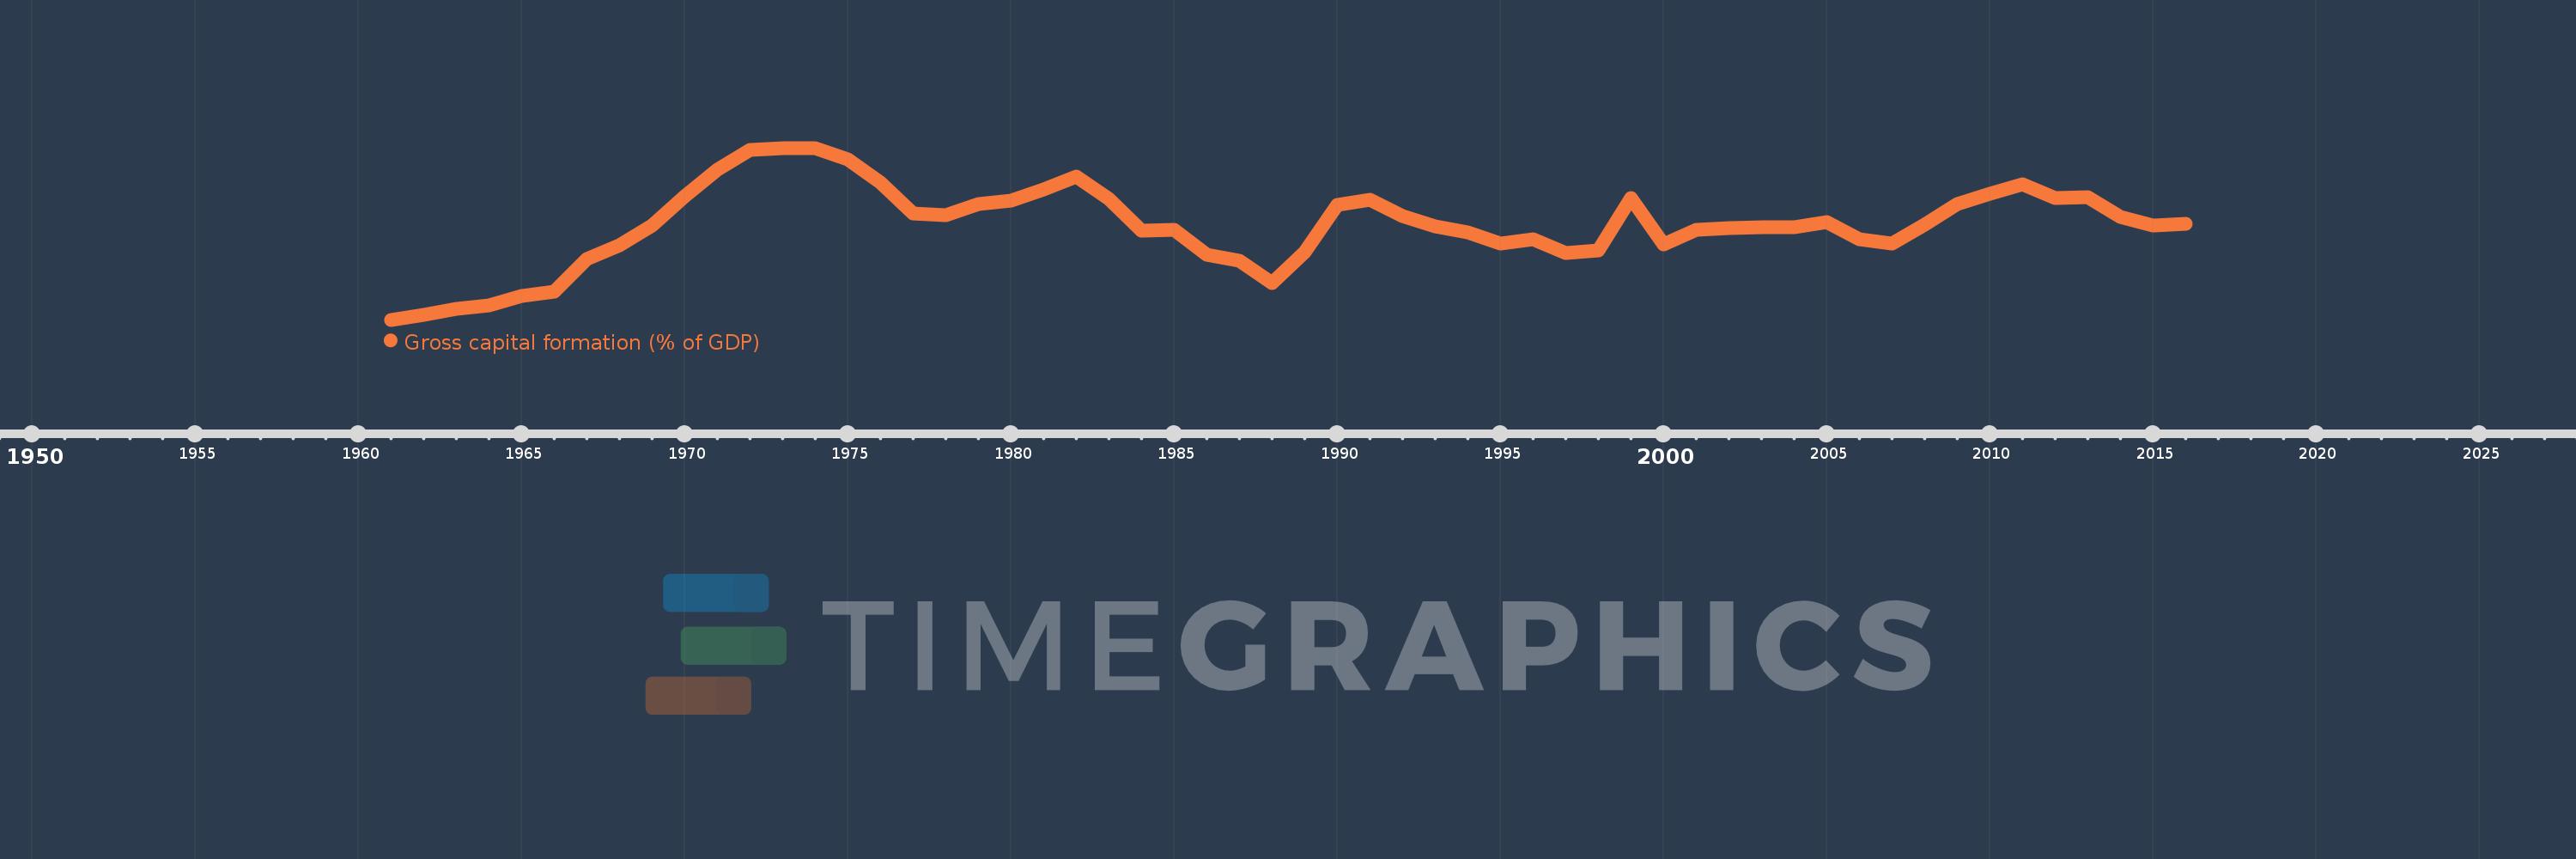
Gross capital formation (% of GDP)
2016,2015,2014,2013,2012,2011,2010,2009,2008,2007,2006,2005,2004,2003,2002,2001,2000,1999,1998,1997,1996,1995,1994,1993,1992,1991,1990,1989,1988,1987,1986,1985,1984,1983,1982,1981,1980,1979,1978,1977,1976,1975,1974,1973,1972,1971,1970,1969,1968,1967,1966,1965,1964,1963,1962,1961
This statistics in other country:
AfghanistanAlbaniaAlgeriaAngolaAntigua and BarbudaArab WorldArgentinaArmeniaArubaAustraliaAustriaAzerbaijanBahamas, TheBahrainBangladeshBarbadosBelarusBelgiumBelizeBeninBermudaBhutanBoliviaBosnia and HerzegovinaBotswanaBrazilBrunei DarussalamBulgariaBurkina FasoBurundiCabo VerdeCambodiaCameroonCanadaCaribbean small statesCentral African RepublicCentral Europe and the BalticsChadChileChinaColombiaComorosCongo, Dem. Rep.Congo, Rep.Costa RicaCote d'IvoireCroatiaCubaCyprusCzech RepublicDenmarkDjiboutiDominicaDominican RepublicEarly-demographic dividendEast Asia & PacificEast Asia & Pacific (excluding high income)East Asia & Pacific (IDA & IBRD countries)EcuadorEgypt, Arab Rep.El SalvadorEquatorial GuineaEritreaEstoniaEthiopiaEuro areaEurope & Central AsiaEurope & Central Asia (excluding high income)Europe & Central Asia (IDA & IBRD countries)European UnionFaroe IslandsFijiFinlandFragile and conflict affected situationsFranceGabonGambia, TheGeorgiaGermanyGhanaGreeceGrenadaGuatemalaGuineaGuinea-BissauGuyanaHaitiHeavily indebted poor countries (HIPC)High incomeHondurasHong Kong SAR, ChinaHungaryIBRD onlyIcelandIDA & IBRD totalIDA blendIDA onlyIDA totalIndiaIndonesiaIran, Islamic Rep.IraqIrelandIsraelItalyJamaicaJapanJordanKazakhstanKenyaKiribatiKorea, Rep.KosovoKuwaitKyrgyz RepublicLao PDRLate-demographic dividendLatin America & Caribbean Latin America & Caribbean (excluding high income)Latin America & the Caribbean (IDA & IBRD countries)LatviaLeast developed countries: UN classificationLebanonLesothoLiberiaLibyaLithuaniaLow & middle incomeLow incomeLower middle incomeLuxembourgMacao SAR, ChinaMacedonia, FYRMadagascarMalawiMalaysiaMaldivesMaliMaltaMauritaniaMauritiusMexicoMicronesia, Fed. Sts.Middle East & North AfricaMiddle East & North Africa (excluding high income)Middle East & North Africa (IDA & IBRD countries)Middle incomeMoldovaMongoliaMontenegroMoroccoMozambiqueNamibiaNepalNetherlandsNew CaledoniaNew ZealandNicaraguaNigerNigeriaNorth AmericaNorwayOECD membersOmanOther small statesPacific island small statesPakistanPanamaPapua New GuineaParaguayPeruPhilippinesPolandPortugalPost-demographic dividendPre-demographic dividendPuerto RicoQatarRomaniaRussian FederationRwandaSaudi ArabiaSenegalSerbiaSeychellesSierra LeoneSingaporeSlovak RepublicSloveniaSmall statesSolomon IslandsSomaliaSouth AfricaSouth AsiaSouth Asia (IDA & IBRD)South SudanSpainSri LankaSt. Kitts and NevisSt. LuciaSt. Vincent and the GrenadinesSub-Saharan Africa Sub-Saharan Africa (excluding high income)Sub-Saharan Africa (IDA & IBRD countries)SudanSurinameSwazilandSwedenSwitzerlandSyrian Arab RepublicTajikistanTanzaniaThailandTimor-LesteTogoTongaTrinidad and TobagoTunisiaTurkeyTurkmenistanUgandaUkraineUnited Arab EmiratesUnited KingdomUnited StatesUpper middle incomeUruguayUzbekistanVanuatuVenezuela, RBVietnamWest Bank and GazaWorldYemen, Rep.ZambiaZimbabwe Timeline:
This timeline shows a graph from 1961 to 2016 of Botswana. No data until 1960. Number of actual observations by date: 56.
Source name:
World Development Indicators
Source organization:
World Bank national accounts data, and OECD National Accounts data files.
Categories, topics:
Economy & Growth
Last updated:
apr 23, 2017
Indicators value changes by year
Maximum:
50.944
jan 1, 1973
At the date of observation
Value
Absolute change
Change from previous value
jan 1, 1961
6.016
+6.016
0.0%
jan 1, 1962
7.399
+1.384
23.0%
jan 1, 1963
8.799
+1.4
18.92%
jan 1, 1964
9.807
+1.008
11.46%
jan 1, 1965
12.283
+2.476
25.24%
jan 1, 1966
13.262
+0.979
7.97%
jan 1, 1967
21.816
+8.554
64.5%
jan 1, 1968
25.446
+3.63
16.64%
jan 1, 1969
30.737
+5.291
20.79%
jan 1, 1970
38.254
+7.517
24.46%
jan 1, 1971
45.323
+7.069
18.48%
jan 1, 1972
50.441
+5.118
11.29%
jan 1, 1973
50.944
+0.504
1.0%
jan 1, 1974
50.9
-0.044
-0.09%
jan 1, 1975
47.872
-3.028
-5.95%
jan 1, 1976
41.9
-5.972
-12.48%
jan 1, 1977
33.771
-8.129
-19.4%
jan 1, 1978
33.465
-0.306
-0.91%
jan 1, 1979
36.364
+2.899
8.66%
jan 1, 1980
37.219
+0.856
2.35%
jan 1, 1981
40.052
+2.833
7.61%
jan 1, 1982
43.406
+3.354
8.37%
jan 1, 1983
37.658
-5.747
-13.24%
jan 1, 1984
29.389
-8.269
-21.96%
jan 1, 1985
29.444
+0.054
0.19%
jan 1, 1986
22.994
-6.449
-21.9%
jan 1, 1987
21.485
-1.509
-6.56%
jan 1, 1988
15.501
-5.985
-27.85%
jan 1, 1989
23.585
+8.084
52.15%
jan 1, 1990
36.108
+12.524
53.1%
jan 1, 1991
37.367
+1.259
3.49%
jan 1, 1992
33.21
-4.157
-11.12%
jan 1, 1993
30.419
-2.791
-8.4%
jan 1, 1994
28.78
-1.64
-5.39%
jan 1, 1995
25.983
-2.797
-9.72%
jan 1, 1996
27.13
+1.148
4.42%
jan 1, 1997
23.444
-3.687
-13.59%
jan 1, 1998
24.052
+0.608
2.6%
jan 1, 1999
37.937
+13.885
57.73%
jan 1, 2000
25.626
-12.311
-32.45%
jan 1, 2001
29.551
+3.925
15.32%
jan 1, 2002
29.888
+0.337
1.14%
jan 1, 2003
30.194
+0.306
1.02%
jan 1, 2004
30.143
-0.051
-0.17%
jan 1, 2005
31.48
+1.337
4.43%
jan 1, 2006
27.15
-4.329
-13.75%
jan 1, 2007
25.905
-1.246
-4.59%
jan 1, 2008
30.792
+4.888
18.87%
jan 1, 2009
36.187
+5.395
17.52%
jan 1, 2010
38.93
+2.743
7.58%
jan 1, 2011
41.412
+2.482
6.38%
jan 1, 2012
37.761
-3.651
-8.82%
jan 1, 2013
38.137
+0.376
0.99%
jan 1, 2014
32.877
-5.26
-13.79%
jan 1, 2015
30.625
-2.252
-6.85%
jan 1, 2016
31.13
+0.505
1.65%
Ranking of countries by current statistics by years


Comments: