29
/
en
AIzaSyAYiBZKx7MnpbEhh9jyipgxe19OcubqV5w
April 1, 2024
277716
Uruguay
URY
true
2
1
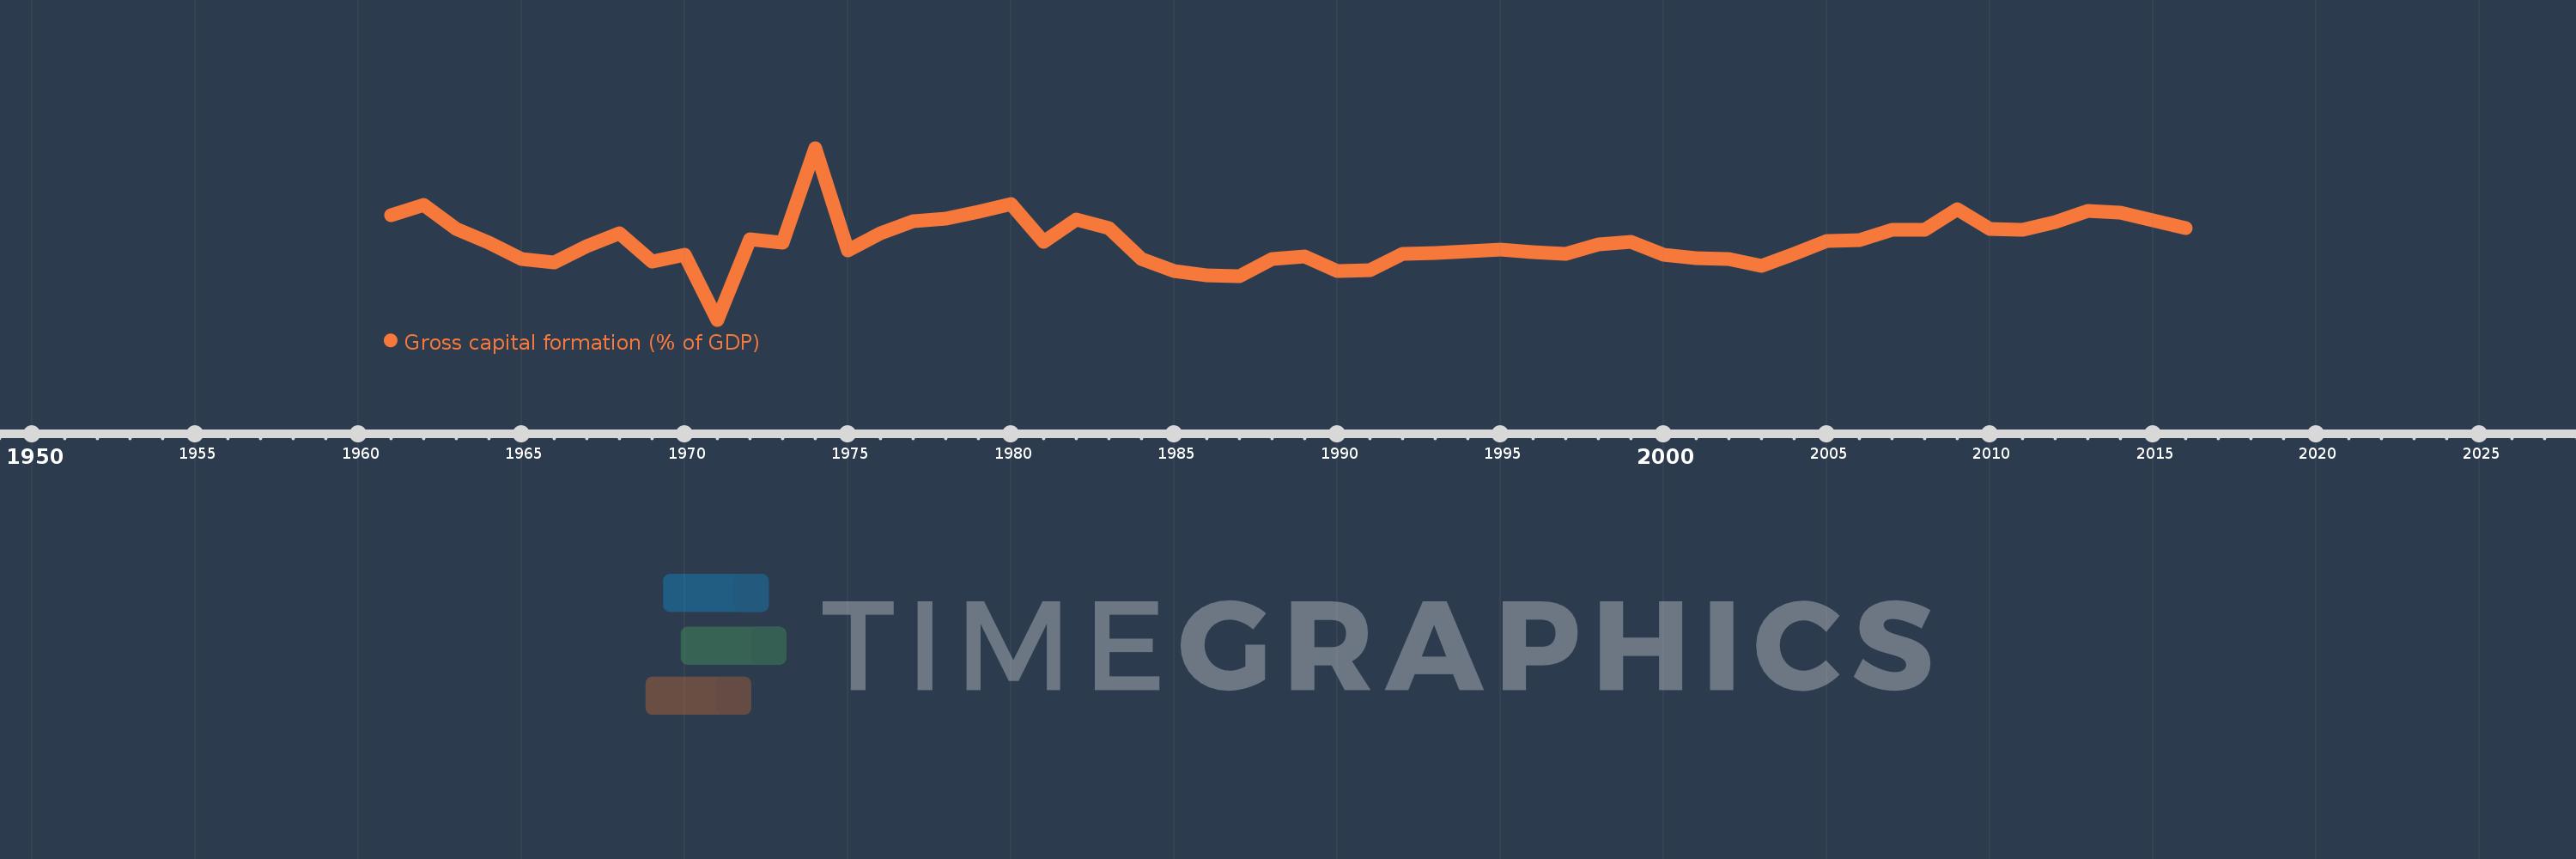
Gross capital formation (% of GDP)
2016,2015,2014,2013,2012,2011,2010,2009,2008,2007,2006,2005,2004,2003,2002,2001,2000,1999,1998,1997,1996,1995,1994,1993,1992,1991,1990,1989,1988,1987,1986,1985,1984,1983,1982,1981,1980,1979,1978,1977,1976,1975,1974,1973,1972,1971,1970,1969,1968,1967,1966,1965,1964,1963,1962,1961
This statistics in other country:
AfghanistanAlbaniaAlgeriaAngolaAntigua and BarbudaArab WorldArgentinaArmeniaArubaAustraliaAustriaAzerbaijanBahamas, TheBahrainBangladeshBarbadosBelarusBelgiumBelizeBeninBermudaBhutanBoliviaBosnia and HerzegovinaBotswanaBrazilBrunei DarussalamBulgariaBurkina FasoBurundiCabo VerdeCambodiaCameroonCanadaCaribbean small statesCentral African RepublicCentral Europe and the BalticsChadChileChinaColombiaComorosCongo, Dem. Rep.Congo, Rep.Costa RicaCote d'IvoireCroatiaCubaCyprusCzech RepublicDenmarkDjiboutiDominicaDominican RepublicEarly-demographic dividendEast Asia & PacificEast Asia & Pacific (excluding high income)East Asia & Pacific (IDA & IBRD countries)EcuadorEgypt, Arab Rep.El SalvadorEquatorial GuineaEritreaEstoniaEthiopiaEuro areaEurope & Central AsiaEurope & Central Asia (excluding high income)Europe & Central Asia (IDA & IBRD countries)European UnionFaroe IslandsFijiFinlandFragile and conflict affected situationsFranceGabonGambia, TheGeorgiaGermanyGhanaGreeceGrenadaGuatemalaGuineaGuinea-BissauGuyanaHaitiHeavily indebted poor countries (HIPC)High incomeHondurasHong Kong SAR, ChinaHungaryIBRD onlyIcelandIDA & IBRD totalIDA blendIDA onlyIDA totalIndiaIndonesiaIran, Islamic Rep.IraqIrelandIsraelItalyJamaicaJapanJordanKazakhstanKenyaKiribatiKorea, Rep.KosovoKuwaitKyrgyz RepublicLao PDRLate-demographic dividendLatin America & Caribbean Latin America & Caribbean (excluding high income)Latin America & the Caribbean (IDA & IBRD countries)LatviaLeast developed countries: UN classificationLebanonLesothoLiberiaLibyaLithuaniaLow & middle incomeLow incomeLower middle incomeLuxembourgMacao SAR, ChinaMacedonia, FYRMadagascarMalawiMalaysiaMaldivesMaliMaltaMauritaniaMauritiusMexicoMicronesia, Fed. Sts.Middle East & North AfricaMiddle East & North Africa (excluding high income)Middle East & North Africa (IDA & IBRD countries)Middle incomeMoldovaMongoliaMontenegroMoroccoMozambiqueNamibiaNepalNetherlandsNew CaledoniaNew ZealandNicaraguaNigerNigeriaNorth AmericaNorwayOECD membersOmanOther small statesPacific island small statesPakistanPanamaPapua New GuineaParaguayPeruPhilippinesPolandPortugalPost-demographic dividendPre-demographic dividendPuerto RicoQatarRomaniaRussian FederationRwandaSaudi ArabiaSenegalSerbiaSeychellesSierra LeoneSingaporeSlovak RepublicSloveniaSmall statesSolomon IslandsSomaliaSouth AfricaSouth AsiaSouth Asia (IDA & IBRD)South SudanSpainSri LankaSt. Kitts and NevisSt. LuciaSt. Vincent and the GrenadinesSub-Saharan Africa Sub-Saharan Africa (excluding high income)Sub-Saharan Africa (IDA & IBRD countries)SudanSurinameSwazilandSwedenSwitzerlandSyrian Arab RepublicTajikistanTanzaniaThailandTimor-LesteTogoTongaTrinidad and TobagoTunisiaTurkeyTurkmenistanUgandaUkraineUnited Arab EmiratesUnited KingdomUnited StatesUpper middle incomeUruguayUzbekistanVanuatuVenezuela, RBVietnamWest Bank and GazaWorldYemen, Rep.ZambiaZimbabwe Timeline:
This timeline shows a graph from 1961 to 2016 of Uruguay. No data until 1960. Number of actual observations by date: 56.
Source name:
World Development Indicators
Source organization:
World Bank national accounts data, and OECD National Accounts data files.
Categories, topics:
Economy & Growth
Last updated:
apr 23, 2017
Indicators value changes by year
Maximum:
34.108
jan 1, 1974
At the date of observation
Value
Absolute change
Change from previous value
jan 1, 1961
22.069
+22.069
0.0%
jan 1, 1962
23.864
+1.795
8.13%
jan 1, 1963
19.588
-4.276
-17.92%
jan 1, 1964
17.167
-2.42
-12.36%
jan 1, 1965
14.328
-2.839
-16.54%
jan 1, 1966
13.661
-0.667
-4.66%
jan 1, 1967
16.513
+2.852
20.87%
jan 1, 1968
18.784
+2.271
13.75%
jan 1, 1969
13.857
-4.927
-26.23%
jan 1, 1970
14.947
+1.09
7.87%
jan 1, 1971
3.396
-11.55
-77.28%
jan 1, 1972
17.739
+14.343
422.32%
jan 1, 1973
17.157
-0.582
-3.28%
jan 1, 1974
34.108
+16.951
98.8%
jan 1, 1975
15.853
-18.255
-53.52%
jan 1, 1976
18.898
+3.044
19.2%
jan 1, 1977
20.959
+2.061
10.91%
jan 1, 1978
21.485
+0.526
2.51%
jan 1, 1979
22.71
+1.225
5.7%
jan 1, 1980
24.042
+1.331
5.86%
jan 1, 1981
17.346
-6.695
-27.85%
jan 1, 1982
21.39
+4.044
23.31%
jan 1, 1983
19.797
-1.594
-7.45%
jan 1, 1984
14.254
-5.543
-28.0%
jan 1, 1985
12.127
-2.127
-14.92%
jan 1, 1986
11.379
-0.748
-6.17%
jan 1, 1987
11.182
-0.197
-1.73%
jan 1, 1988
14.295
+3.113
27.84%
jan 1, 1989
14.67
+0.375
2.62%
jan 1, 1990
12.066
-2.603
-17.75%
jan 1, 1991
12.201
+0.134
1.11%
jan 1, 1992
15.125
+2.924
23.97%
jan 1, 1993
15.385
+0.26
1.72%
jan 1, 1994
15.641
+0.256
1.67%
jan 1, 1995
15.872
+0.23
1.47%
jan 1, 1996
15.408
-0.464
-2.92%
jan 1, 1997
15.24
-0.167
-1.09%
jan 1, 1998
16.845
+1.605
10.53%
jan 1, 1999
17.338
+0.492
2.92%
jan 1, 2000
15.075
-2.262
-13.05%
jan 1, 2001
14.457
-0.618
-4.1%
jan 1, 2002
14.328
-0.129
-0.89%
jan 1, 2003
13.073
-1.255
-8.76%
jan 1, 2004
15.206
+2.133
16.32%
jan 1, 2005
17.468
+2.262
14.88%
jan 1, 2006
17.699
+0.23
1.32%
jan 1, 2007
19.461
+1.762
9.95%
jan 1, 2008
19.526
+0.065
0.34%
jan 1, 2009
23.208
+3.682
18.86%
jan 1, 2010
19.625
-3.583
-15.44%
jan 1, 2011
19.408
-0.217
-1.11%
jan 1, 2012
20.882
+1.475
7.6%
jan 1, 2013
22.915
+2.033
9.74%
jan 1, 2014
22.484
-0.431
-1.88%
jan 1, 2015
21.203
-1.282
-5.7%
jan 1, 2016
19.821
-1.382
-6.52%
Ranking of countries by current statistics by years


Comments: