29
/
en
AIzaSyAYiBZKx7MnpbEhh9jyipgxe19OcubqV5w
April 1, 2024
282333
Vietnam
VNM
true
2
1
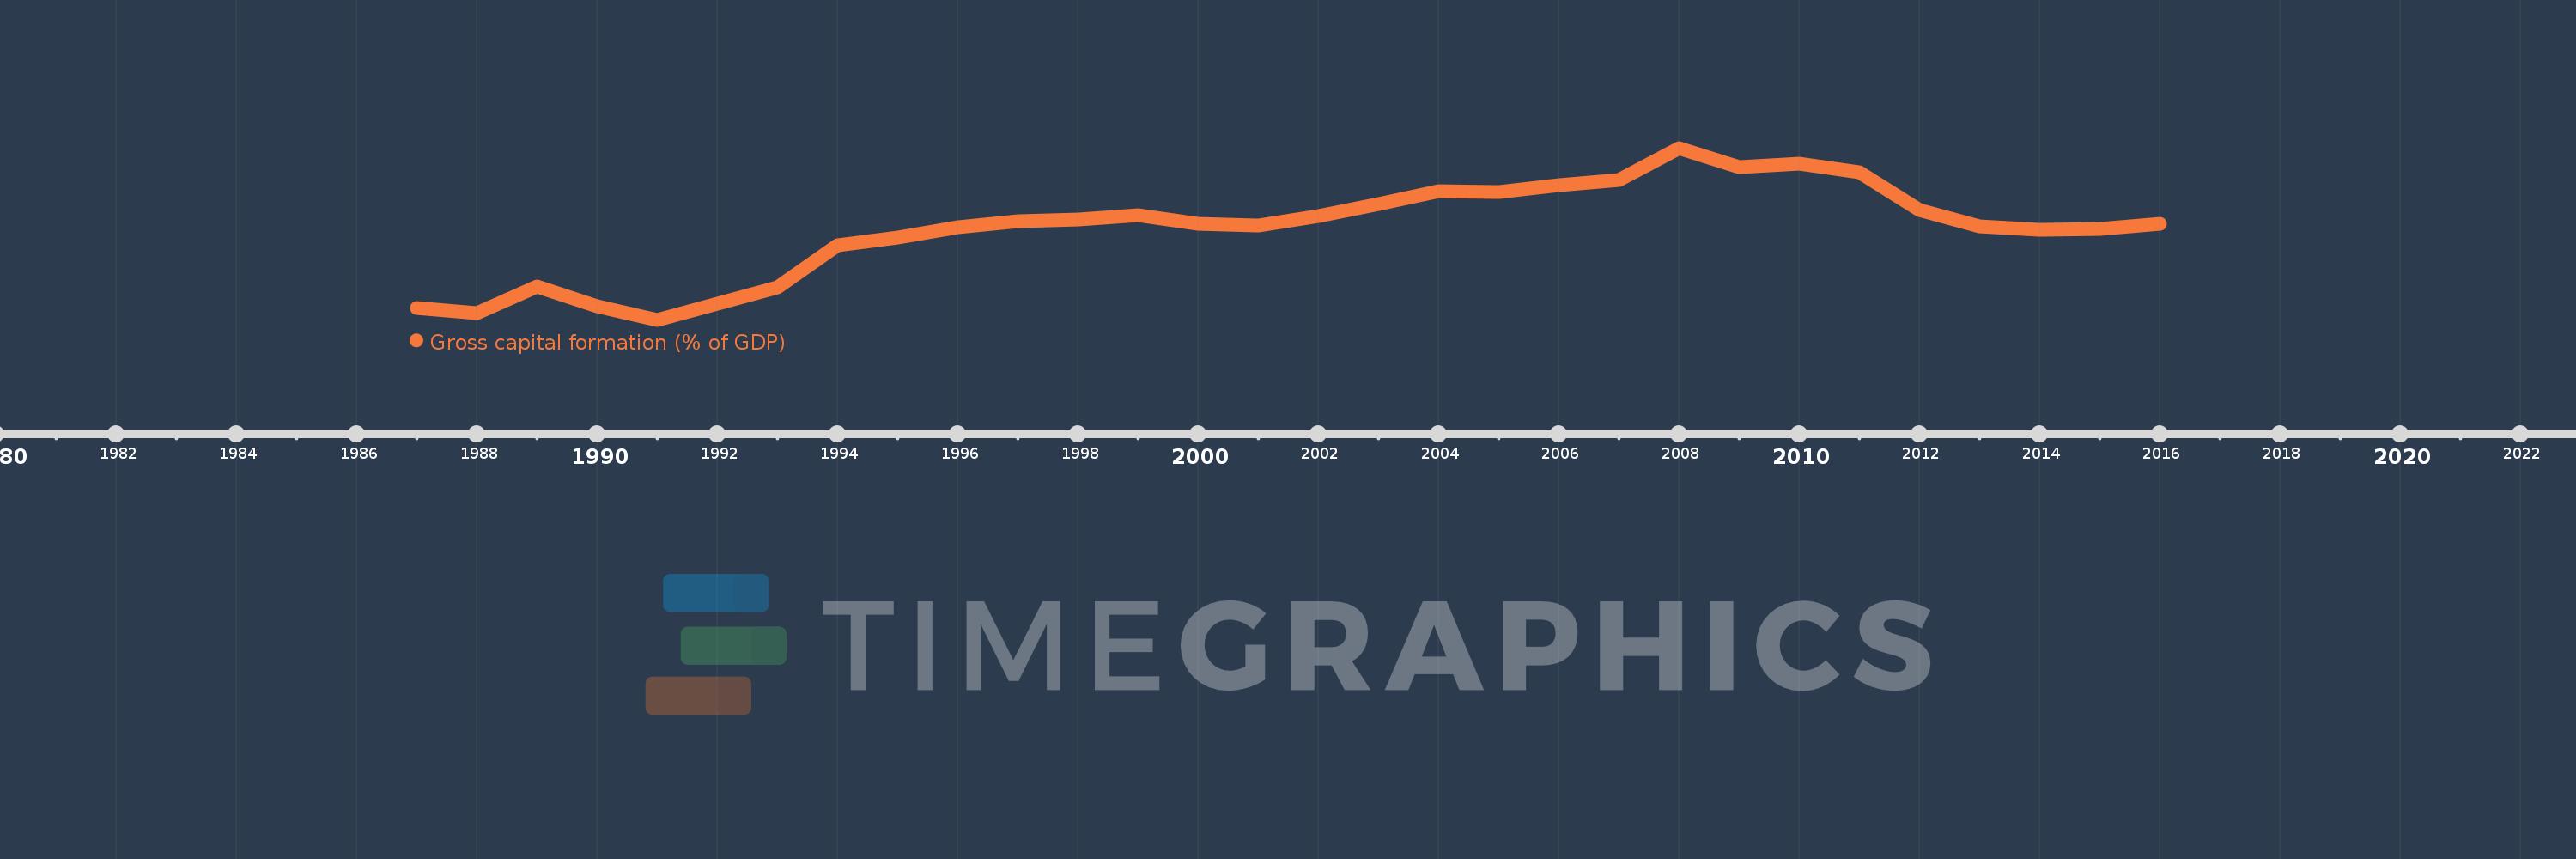
Gross capital formation (% of GDP)
2016,2015,2014,2013,2012,2011,2010,2009,2008,2007,2006,2005,2004,2003,2002,2001,2000,1999,1998,1997,1996,1995,1994,1993,1992,1991,1990,1989,1988,1987
This statistics in other country:
AfghanistanAlbaniaAlgeriaAngolaAntigua and BarbudaArab WorldArgentinaArmeniaArubaAustraliaAustriaAzerbaijanBahamas, TheBahrainBangladeshBarbadosBelarusBelgiumBelizeBeninBermudaBhutanBoliviaBosnia and HerzegovinaBotswanaBrazilBrunei DarussalamBulgariaBurkina FasoBurundiCabo VerdeCambodiaCameroonCanadaCaribbean small statesCentral African RepublicCentral Europe and the BalticsChadChileChinaColombiaComorosCongo, Dem. Rep.Congo, Rep.Costa RicaCote d'IvoireCroatiaCubaCyprusCzech RepublicDenmarkDjiboutiDominicaDominican RepublicEarly-demographic dividendEast Asia & PacificEast Asia & Pacific (excluding high income)East Asia & Pacific (IDA & IBRD countries)EcuadorEgypt, Arab Rep.El SalvadorEquatorial GuineaEritreaEstoniaEthiopiaEuro areaEurope & Central AsiaEurope & Central Asia (excluding high income)Europe & Central Asia (IDA & IBRD countries)European UnionFaroe IslandsFijiFinlandFragile and conflict affected situationsFranceGabonGambia, TheGeorgiaGermanyGhanaGreeceGrenadaGuatemalaGuineaGuinea-BissauGuyanaHaitiHeavily indebted poor countries (HIPC)High incomeHondurasHong Kong SAR, ChinaHungaryIBRD onlyIcelandIDA & IBRD totalIDA blendIDA onlyIDA totalIndiaIndonesiaIran, Islamic Rep.IraqIrelandIsraelItalyJamaicaJapanJordanKazakhstanKenyaKiribatiKorea, Rep.KosovoKuwaitKyrgyz RepublicLao PDRLate-demographic dividendLatin America & Caribbean Latin America & Caribbean (excluding high income)Latin America & the Caribbean (IDA & IBRD countries)LatviaLeast developed countries: UN classificationLebanonLesothoLiberiaLibyaLithuaniaLow & middle incomeLow incomeLower middle incomeLuxembourgMacao SAR, ChinaMacedonia, FYRMadagascarMalawiMalaysiaMaldivesMaliMaltaMauritaniaMauritiusMexicoMicronesia, Fed. Sts.Middle East & North AfricaMiddle East & North Africa (excluding high income)Middle East & North Africa (IDA & IBRD countries)Middle incomeMoldovaMongoliaMontenegroMoroccoMozambiqueNamibiaNepalNetherlandsNew CaledoniaNew ZealandNicaraguaNigerNigeriaNorth AmericaNorwayOECD membersOmanOther small statesPacific island small statesPakistanPanamaPapua New GuineaParaguayPeruPhilippinesPolandPortugalPost-demographic dividendPre-demographic dividendPuerto RicoQatarRomaniaRussian FederationRwandaSaudi ArabiaSenegalSerbiaSeychellesSierra LeoneSingaporeSlovak RepublicSloveniaSmall statesSolomon IslandsSomaliaSouth AfricaSouth AsiaSouth Asia (IDA & IBRD)South SudanSpainSri LankaSt. Kitts and NevisSt. LuciaSt. Vincent and the GrenadinesSub-Saharan Africa Sub-Saharan Africa (excluding high income)Sub-Saharan Africa (IDA & IBRD countries)SudanSurinameSwazilandSwedenSwitzerlandSyrian Arab RepublicTajikistanTanzaniaThailandTimor-LesteTogoTongaTrinidad and TobagoTunisiaTurkeyTurkmenistanUgandaUkraineUnited Arab EmiratesUnited KingdomUnited StatesUpper middle incomeUruguayUzbekistanVanuatuVenezuela, RBVietnamWest Bank and GazaWorldYemen, Rep.ZambiaZimbabwe Timeline:
This timeline shows a graph from 1987 to 2016 of Vietnam. No data until 1986. Number of actual observations by date: 30.
Source name:
World Development Indicators
Source organization:
World Bank national accounts data, and OECD National Accounts data files.
Categories, topics:
Economy & Growth
Last updated:
apr 23, 2017
Indicators value changes by year
Minimum:
12.566
jan 1, 1991
Maximum:
39.566
jan 1, 2008
At the date of observation
Value
Absolute change
Change from previous value
jan 1, 1987
14.424
+14.424
0.0%
jan 1, 1988
13.561
-0.863
-5.98%
jan 1, 1989
17.844
+4.283
31.59%
jan 1, 1990
14.631
-3.214
-18.01%
jan 1, 1991
12.566
-2.065
-14.11%
jan 1, 1992
15.07
+2.504
19.93%
jan 1, 1993
17.64
+2.57
17.05%
jan 1, 1994
24.255
+6.615
37.5%
jan 1, 1995
25.476
+1.221
5.03%
jan 1, 1996
27.144
+1.668
6.55%
jan 1, 1997
28.103
+0.959
3.53%
jan 1, 1998
28.3
+0.197
0.7%
jan 1, 1999
29.05
+0.75
2.65%
jan 1, 2000
27.63
-1.42
-4.89%
jan 1, 2001
27.438
-0.192
-0.69%
jan 1, 2002
28.871
+1.433
5.22%
jan 1, 2003
30.696
+1.825
6.32%
jan 1, 2004
32.819
+2.123
6.92%
jan 1, 2005
32.598
-0.221
-0.67%
jan 1, 2006
33.757
+1.16
3.56%
jan 1, 2007
34.537
+0.779
2.31%
jan 1, 2008
39.566
+5.03
14.56%
jan 1, 2009
36.493
-3.073
-7.77%
jan 1, 2010
37.163
+0.669
1.83%
jan 1, 2011
35.694
-1.469
-3.95%
jan 1, 2012
29.751
-5.943
-16.65%
jan 1, 2013
27.243
-2.507
-8.43%
jan 1, 2014
26.676
-0.568
-2.08%
jan 1, 2015
26.833
+0.157
0.59%
jan 1, 2016
27.677
+0.844
3.15%
Ranking of countries by current statistics by years


Comments: