29
/
en
AIzaSyAYiBZKx7MnpbEhh9jyipgxe19OcubqV5w
April 1, 2024
257348
Switzerland
CHE
true
2
1
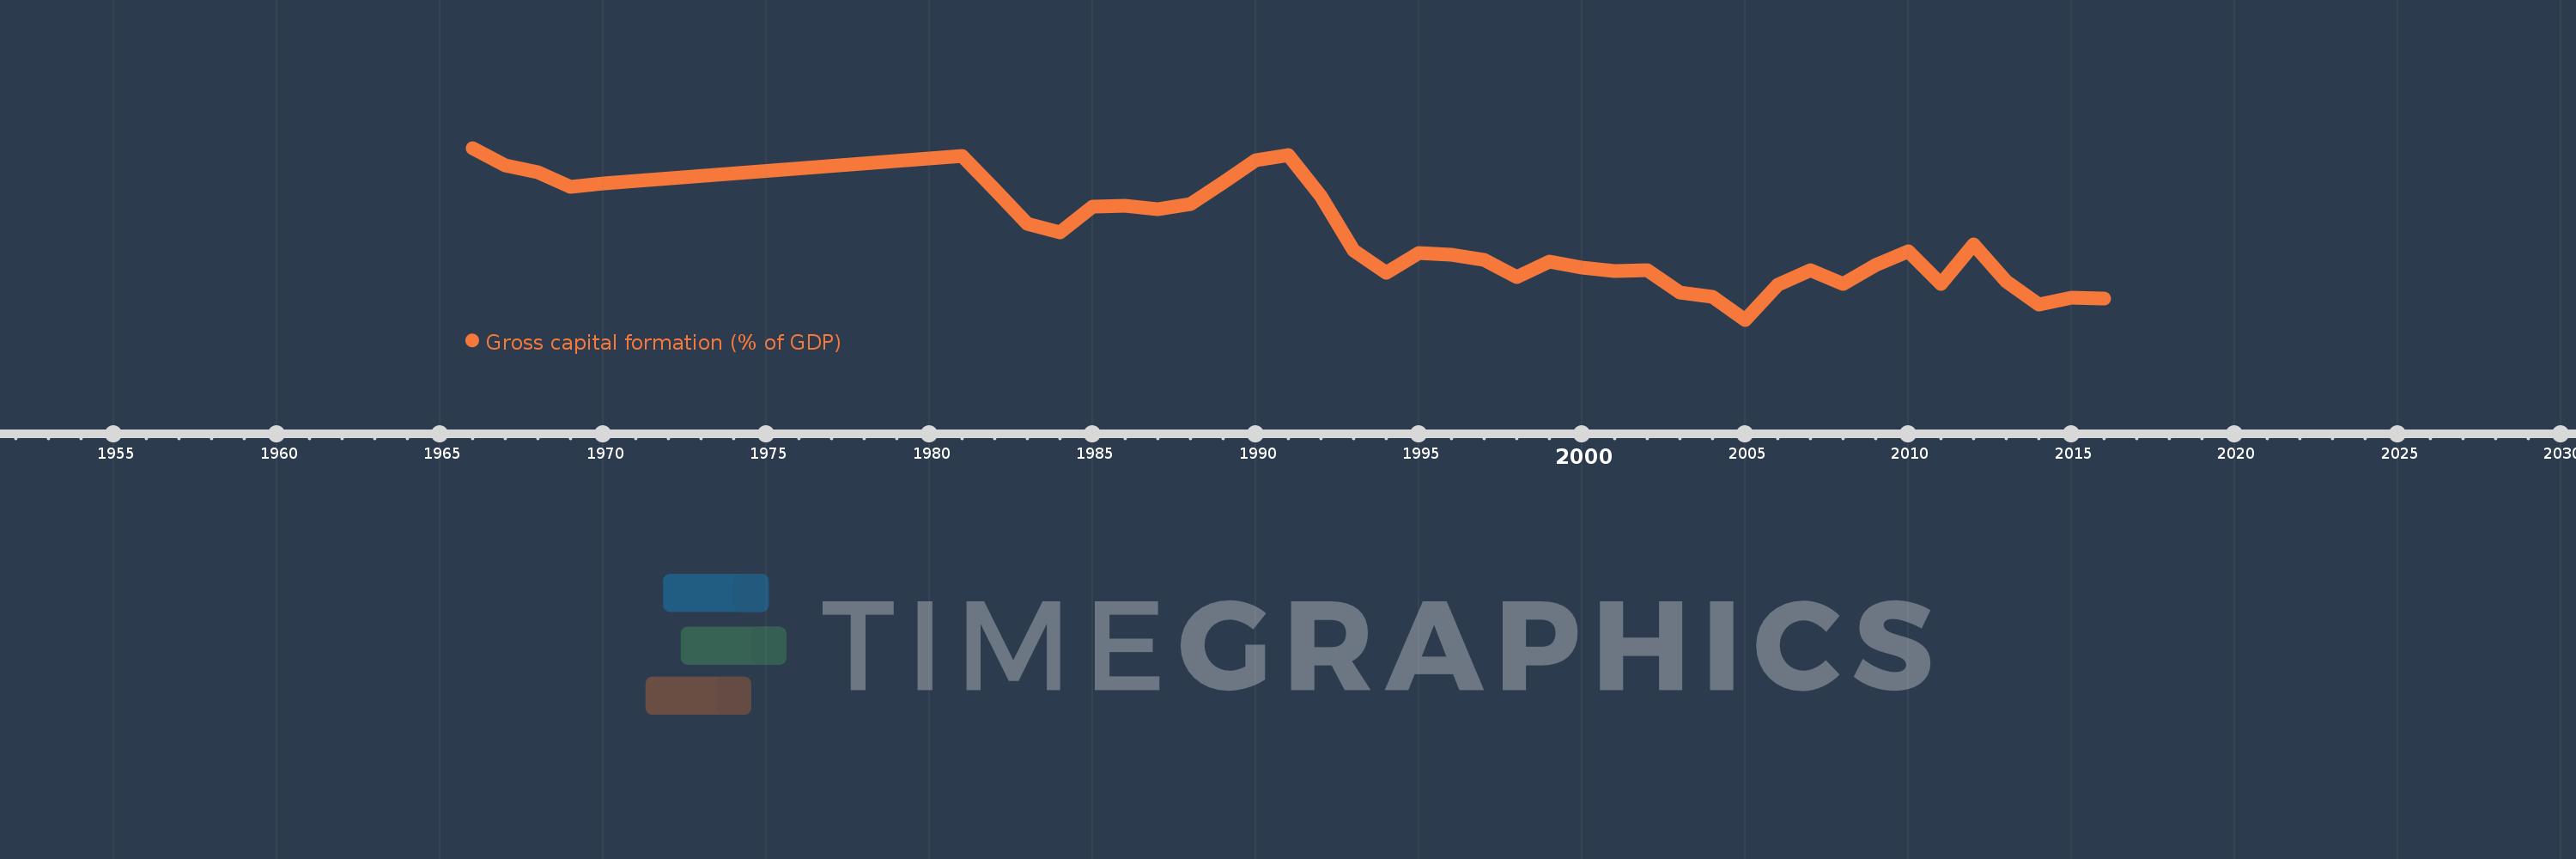
Gross capital formation (% of GDP)
2016,2015,2014,2013,2012,2011,2010,2009,2008,2007,2006,2005,2004,2003,2002,2001,2000,1999,1998,1997,1996,1995,1994,1993,1992,1991,1990,1989,1988,1987,1986,1985,1984,1983,1982,1981,1970,1969,1968,1967,1966
This statistics in other country:
AfghanistanAlbaniaAlgeriaAngolaAntigua and BarbudaArab WorldArgentinaArmeniaArubaAustraliaAustriaAzerbaijanBahamas, TheBahrainBangladeshBarbadosBelarusBelgiumBelizeBeninBermudaBhutanBoliviaBosnia and HerzegovinaBotswanaBrazilBrunei DarussalamBulgariaBurkina FasoBurundiCabo VerdeCambodiaCameroonCanadaCaribbean small statesCentral African RepublicCentral Europe and the BalticsChadChileChinaColombiaComorosCongo, Dem. Rep.Congo, Rep.Costa RicaCote d'IvoireCroatiaCubaCyprusCzech RepublicDenmarkDjiboutiDominicaDominican RepublicEarly-demographic dividendEast Asia & PacificEast Asia & Pacific (excluding high income)East Asia & Pacific (IDA & IBRD countries)EcuadorEgypt, Arab Rep.El SalvadorEquatorial GuineaEritreaEstoniaEthiopiaEuro areaEurope & Central AsiaEurope & Central Asia (excluding high income)Europe & Central Asia (IDA & IBRD countries)European UnionFaroe IslandsFijiFinlandFragile and conflict affected situationsFranceGabonGambia, TheGeorgiaGermanyGhanaGreeceGrenadaGuatemalaGuineaGuinea-BissauGuyanaHaitiHeavily indebted poor countries (HIPC)High incomeHondurasHong Kong SAR, ChinaHungaryIBRD onlyIcelandIDA & IBRD totalIDA blendIDA onlyIDA totalIndiaIndonesiaIran, Islamic Rep.IraqIrelandIsraelItalyJamaicaJapanJordanKazakhstanKenyaKiribatiKorea, Rep.KosovoKuwaitKyrgyz RepublicLao PDRLate-demographic dividendLatin America & Caribbean Latin America & Caribbean (excluding high income)Latin America & the Caribbean (IDA & IBRD countries)LatviaLeast developed countries: UN classificationLebanonLesothoLiberiaLibyaLithuaniaLow & middle incomeLow incomeLower middle incomeLuxembourgMacao SAR, ChinaMacedonia, FYRMadagascarMalawiMalaysiaMaldivesMaliMaltaMauritaniaMauritiusMexicoMicronesia, Fed. Sts.Middle East & North AfricaMiddle East & North Africa (excluding high income)Middle East & North Africa (IDA & IBRD countries)Middle incomeMoldovaMongoliaMontenegroMoroccoMozambiqueNamibiaNepalNetherlandsNew CaledoniaNew ZealandNicaraguaNigerNigeriaNorth AmericaNorwayOECD membersOmanOther small statesPacific island small statesPakistanPanamaPapua New GuineaParaguayPeruPhilippinesPolandPortugalPost-demographic dividendPre-demographic dividendPuerto RicoQatarRomaniaRussian FederationRwandaSaudi ArabiaSenegalSerbiaSeychellesSierra LeoneSingaporeSlovak RepublicSloveniaSmall statesSolomon IslandsSomaliaSouth AfricaSouth AsiaSouth Asia (IDA & IBRD)South SudanSpainSri LankaSt. Kitts and NevisSt. LuciaSt. Vincent and the GrenadinesSub-Saharan Africa Sub-Saharan Africa (excluding high income)Sub-Saharan Africa (IDA & IBRD countries)SudanSurinameSwazilandSwedenSwitzerlandSyrian Arab RepublicTajikistanTanzaniaThailandTimor-LesteTogoTongaTrinidad and TobagoTunisiaTurkeyTurkmenistanUgandaUkraineUnited Arab EmiratesUnited KingdomUnited StatesUpper middle incomeUruguayUzbekistanVanuatuVenezuela, RBVietnamWest Bank and GazaWorldYemen, Rep.ZambiaZimbabwe Timeline:
This timeline shows a graph from 1966 to 2016 of Switzerland. No data until 1965. Number of actual observations by date: 41.
Source name:
World Development Indicators
Source organization:
World Bank national accounts data, and OECD National Accounts data files.
Categories, topics:
Economy & Growth
Last updated:
apr 23, 2017
Indicators value changes by year
Minimum:
21.531
jan 1, 2005
Maximum:
33.758
jan 1, 1966
At the date of observation
Value
Absolute change
Change from previous value
jan 1, 1966
33.758
+33.758
0.0%
jan 1, 1967
32.487
-1.27
-3.76%
jan 1, 1968
32.052
-0.436
-1.34%
jan 1, 1969
30.995
-1.057
-3.3%
jan 1, 1970
31.209
+0.214
0.69%
jan 1, 1981
33.204
+1.995
6.39%
jan 1, 1982
30.801
-2.403
-7.24%
jan 1, 1983
28.377
-2.424
-7.87%
jan 1, 1984
27.777
-0.6
-2.12%
jan 1, 1985
29.591
+1.814
6.53%
jan 1, 1986
29.623
+0.032
0.11%
jan 1, 1987
29.404
-0.218
-0.74%
jan 1, 1988
29.753
+0.349
1.19%
jan 1, 1989
31.292
+1.539
5.17%
jan 1, 1990
32.911
+1.618
5.17%
jan 1, 1991
33.225
+0.314
0.95%
jan 1, 1992
30.32
-2.905
-8.74%
jan 1, 1993
26.445
-3.875
-12.78%
jan 1, 1994
24.878
-1.567
-5.93%
jan 1, 1995
26.257
+1.379
5.54%
jan 1, 1996
26.157
-0.101
-0.38%
jan 1, 1997
25.82
-0.337
-1.29%
jan 1, 1998
24.555
-1.264
-4.9%
jan 1, 1999
25.652
+1.096
4.46%
jan 1, 2000
25.236
-0.415
-1.62%
jan 1, 2001
25.009
-0.228
-0.9%
jan 1, 2002
25.036
+0.027
0.11%
jan 1, 2003
23.497
-1.539
-6.15%
jan 1, 2004
23.152
-0.345
-1.47%
jan 1, 2005
21.531
-1.62
-7.0%
jan 1, 2006
24.029
+2.497
11.6%
jan 1, 2007
25.048
+1.019
4.24%
jan 1, 2008
24.072
-0.976
-3.9%
jan 1, 2009
25.416
+1.345
5.59%
jan 1, 2010
26.39
+0.973
3.83%
jan 1, 2011
24.069
-2.321
-8.8%
jan 1, 2012
26.867
+2.798
11.62%
jan 1, 2013
24.265
-2.601
-9.68%
jan 1, 2014
22.584
-1.681
-6.93%
jan 1, 2015
23.08
+0.496
2.2%
jan 1, 2016
23.033
-0.047
-0.2%
Ranking of countries by current statistics by years


Comments: