29
/
en
AIzaSyAYiBZKx7MnpbEhh9jyipgxe19OcubqV5w
April 1, 2024
287249
Zimbabwe
ZWE
true
2
1
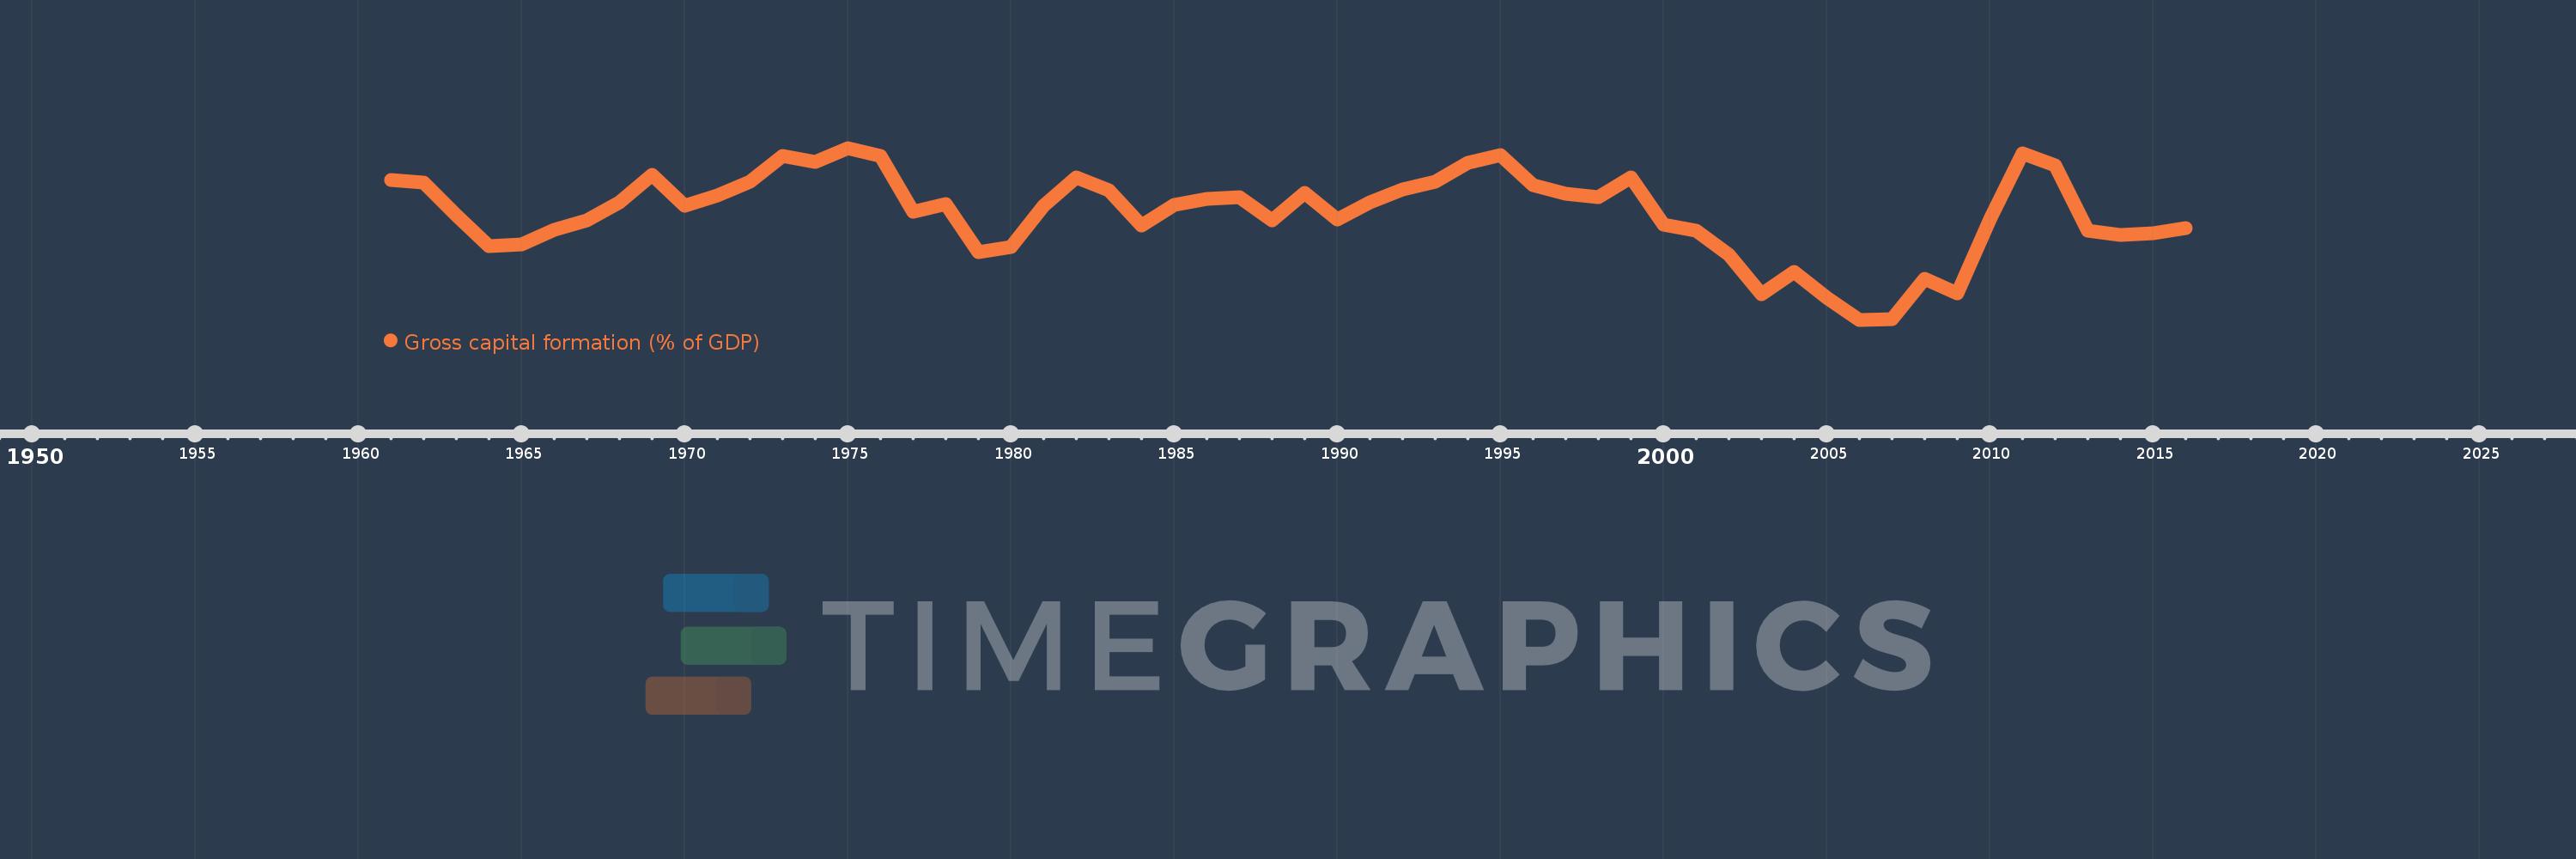
Gross capital formation (% of GDP)
2016,2015,2014,2013,2012,2011,2010,2009,2008,2007,2006,2005,2004,2003,2002,2001,2000,1999,1998,1997,1996,1995,1994,1993,1992,1991,1990,1989,1988,1987,1986,1985,1984,1983,1982,1981,1980,1979,1978,1977,1976,1975,1974,1973,1972,1971,1970,1969,1968,1967,1966,1965,1964,1963,1962,1961
This statistics in other country:
AfghanistanAlbaniaAlgeriaAngolaAntigua and BarbudaArab WorldArgentinaArmeniaArubaAustraliaAustriaAzerbaijanBahamas, TheBahrainBangladeshBarbadosBelarusBelgiumBelizeBeninBermudaBhutanBoliviaBosnia and HerzegovinaBotswanaBrazilBrunei DarussalamBulgariaBurkina FasoBurundiCabo VerdeCambodiaCameroonCanadaCaribbean small statesCentral African RepublicCentral Europe and the BalticsChadChileChinaColombiaComorosCongo, Dem. Rep.Congo, Rep.Costa RicaCote d'IvoireCroatiaCubaCyprusCzech RepublicDenmarkDjiboutiDominicaDominican RepublicEarly-demographic dividendEast Asia & PacificEast Asia & Pacific (excluding high income)East Asia & Pacific (IDA & IBRD countries)EcuadorEgypt, Arab Rep.El SalvadorEquatorial GuineaEritreaEstoniaEthiopiaEuro areaEurope & Central AsiaEurope & Central Asia (excluding high income)Europe & Central Asia (IDA & IBRD countries)European UnionFaroe IslandsFijiFinlandFragile and conflict affected situationsFranceGabonGambia, TheGeorgiaGermanyGhanaGreeceGrenadaGuatemalaGuineaGuinea-BissauGuyanaHaitiHeavily indebted poor countries (HIPC)High incomeHondurasHong Kong SAR, ChinaHungaryIBRD onlyIcelandIDA & IBRD totalIDA blendIDA onlyIDA totalIndiaIndonesiaIran, Islamic Rep.IraqIrelandIsraelItalyJamaicaJapanJordanKazakhstanKenyaKiribatiKorea, Rep.KosovoKuwaitKyrgyz RepublicLao PDRLate-demographic dividendLatin America & Caribbean Latin America & Caribbean (excluding high income)Latin America & the Caribbean (IDA & IBRD countries)LatviaLeast developed countries: UN classificationLebanonLesothoLiberiaLibyaLithuaniaLow & middle incomeLow incomeLower middle incomeLuxembourgMacao SAR, ChinaMacedonia, FYRMadagascarMalawiMalaysiaMaldivesMaliMaltaMauritaniaMauritiusMexicoMicronesia, Fed. Sts.Middle East & North AfricaMiddle East & North Africa (excluding high income)Middle East & North Africa (IDA & IBRD countries)Middle incomeMoldovaMongoliaMontenegroMoroccoMozambiqueNamibiaNepalNetherlandsNew CaledoniaNew ZealandNicaraguaNigerNigeriaNorth AmericaNorwayOECD membersOmanOther small statesPacific island small statesPakistanPanamaPapua New GuineaParaguayPeruPhilippinesPolandPortugalPost-demographic dividendPre-demographic dividendPuerto RicoQatarRomaniaRussian FederationRwandaSaudi ArabiaSenegalSerbiaSeychellesSierra LeoneSingaporeSlovak RepublicSloveniaSmall statesSolomon IslandsSomaliaSouth AfricaSouth AsiaSouth Asia (IDA & IBRD)South SudanSpainSri LankaSt. Kitts and NevisSt. LuciaSt. Vincent and the GrenadinesSub-Saharan Africa Sub-Saharan Africa (excluding high income)Sub-Saharan Africa (IDA & IBRD countries)SudanSurinameSwazilandSwedenSwitzerlandSyrian Arab RepublicTajikistanTanzaniaThailandTimor-LesteTogoTongaTrinidad and TobagoTunisiaTurkeyTurkmenistanUgandaUkraineUnited Arab EmiratesUnited KingdomUnited StatesUpper middle incomeUruguayUzbekistanVanuatuVenezuela, RBVietnamWest Bank and GazaWorldYemen, Rep.ZambiaZimbabwe Timeline:
This timeline shows a graph from 1961 to 2016 of Zimbabwe. No data until 1960. Number of actual observations by date: 56.
Source name:
World Development Indicators
Source organization:
World Bank national accounts data, and OECD National Accounts data files.
Categories, topics:
Economy & Growth
Last updated:
apr 23, 2017
Indicators value changes by year
Maximum:
24.744
jan 1, 1975
At the date of observation
Value
Absolute change
Change from previous value
jan 1, 1961
20.434
+20.434
0.0%
jan 1, 1962
20.05
-0.384
-1.88%
jan 1, 1963
15.599
-4.451
-22.2%
jan 1, 1964
11.513
-4.085
-26.19%
jan 1, 1965
11.742
+0.229
1.99%
jan 1, 1966
13.652
+1.91
16.27%
jan 1, 1967
14.949
+1.296
9.5%
jan 1, 1968
17.426
+2.477
16.57%
jan 1, 1969
21.123
+3.698
21.22%
jan 1, 1970
16.892
-4.232
-20.03%
jan 1, 1971
18.338
+1.446
8.56%
jan 1, 1972
20.171
+1.833
10.0%
jan 1, 1973
23.705
+3.534
17.52%
jan 1, 1974
22.876
-0.829
-3.5%
jan 1, 1975
24.744
+1.868
8.17%
jan 1, 1976
23.632
-1.111
-4.49%
jan 1, 1977
16.111
-7.522
-31.83%
jan 1, 1978
17.186
+1.075
6.67%
jan 1, 1979
10.695
-6.491
-37.77%
jan 1, 1980
11.41
+0.714
6.68%
jan 1, 1981
16.937
+5.527
48.44%
jan 1, 1982
20.816
+3.879
22.9%
jan 1, 1983
19.054
-1.762
-8.47%
jan 1, 1984
14.305
-4.749
-24.92%
jan 1, 1985
17.036
+2.73
19.09%
jan 1, 1986
17.82
+0.784
4.6%
jan 1, 1987
18.056
+0.236
1.33%
jan 1, 1988
14.936
-3.12
-17.28%
jan 1, 1989
18.702
+3.766
25.21%
jan 1, 1990
15.038
-3.664
-19.59%
jan 1, 1991
17.377
+2.339
15.55%
jan 1, 1992
19.103
+1.726
9.94%
jan 1, 1993
20.237
+1.134
5.94%
jan 1, 1994
22.775
+2.538
12.54%
jan 1, 1995
23.729
+0.954
4.19%
jan 1, 1996
19.66
-4.069
-17.15%
jan 1, 1997
18.542
-1.118
-5.69%
jan 1, 1998
18.134
-0.408
-2.2%
jan 1, 1999
20.75
+2.617
14.43%
jan 1, 2000
14.396
-6.354
-30.62%
jan 1, 2001
13.569
-0.827
-5.74%
jan 1, 2002
10.266
-3.303
-24.34%
jan 1, 2003
5.0
-5.266
-51.3%
jan 1, 2004
8.0
+3.0
60.0%
jan 1, 2005
4.509
-3.491
-43.64%
jan 1, 2006
1.525
-2.984
-66.18%
jan 1, 2007
1.571
+0.046
3.02%
jan 1, 2008
7.11
+5.539
352.52%
jan 1, 2009
5.128
-1.982
-27.88%
jan 1, 2010
15.104
+9.977
194.55%
jan 1, 2011
23.98
+8.875
58.76%
jan 1, 2012
22.393
-1.587
-6.62%
jan 1, 2013
13.613
-8.78
-39.21%
jan 1, 2014
13.033
-0.58
-4.26%
jan 1, 2015
13.237
+0.204
1.56%
jan 1, 2016
13.894
+0.657
4.97%
Ranking of countries by current statistics by years


Comments: