29
/
en
AIzaSyAYiBZKx7MnpbEhh9jyipgxe19OcubqV5w
April 1, 2024
78287
Bangladesh
BGD
true
2
1
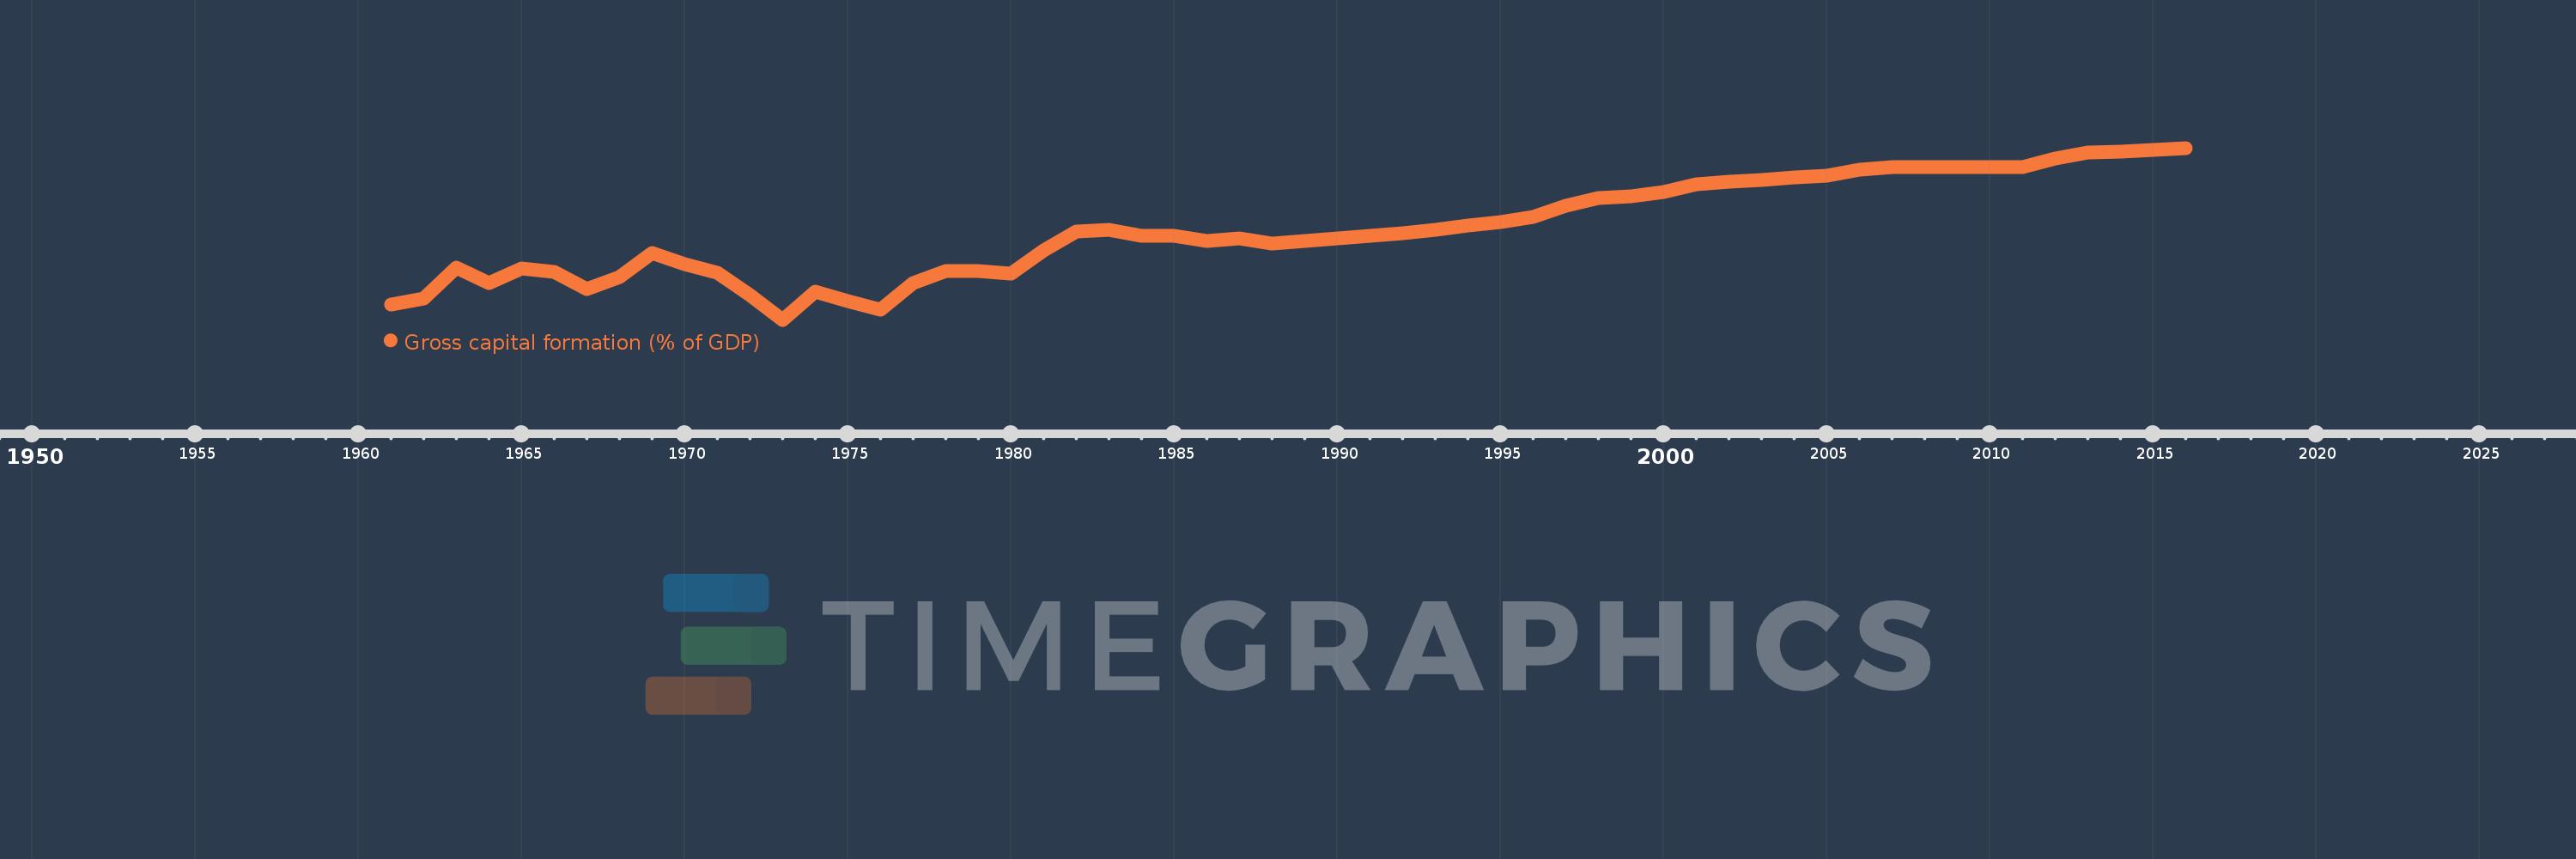
Gross capital formation (% of GDP)
2016,2015,2014,2013,2012,2011,2010,2009,2008,2007,2006,2005,2004,2003,2002,2001,2000,1999,1998,1997,1996,1995,1994,1993,1992,1991,1990,1989,1988,1987,1986,1985,1984,1983,1982,1981,1980,1979,1978,1977,1976,1975,1974,1973,1972,1971,1970,1969,1968,1967,1966,1965,1964,1963,1962,1961
This statistics in other country:
AfghanistanAlbaniaAlgeriaAngolaAntigua and BarbudaArab WorldArgentinaArmeniaArubaAustraliaAustriaAzerbaijanBahamas, TheBahrainBangladeshBarbadosBelarusBelgiumBelizeBeninBermudaBhutanBoliviaBosnia and HerzegovinaBotswanaBrazilBrunei DarussalamBulgariaBurkina FasoBurundiCabo VerdeCambodiaCameroonCanadaCaribbean small statesCentral African RepublicCentral Europe and the BalticsChadChileChinaColombiaComorosCongo, Dem. Rep.Congo, Rep.Costa RicaCote d'IvoireCroatiaCubaCyprusCzech RepublicDenmarkDjiboutiDominicaDominican RepublicEarly-demographic dividendEast Asia & PacificEast Asia & Pacific (excluding high income)East Asia & Pacific (IDA & IBRD countries)EcuadorEgypt, Arab Rep.El SalvadorEquatorial GuineaEritreaEstoniaEthiopiaEuro areaEurope & Central AsiaEurope & Central Asia (excluding high income)Europe & Central Asia (IDA & IBRD countries)European UnionFaroe IslandsFijiFinlandFragile and conflict affected situationsFranceGabonGambia, TheGeorgiaGermanyGhanaGreeceGrenadaGuatemalaGuineaGuinea-BissauGuyanaHaitiHeavily indebted poor countries (HIPC)High incomeHondurasHong Kong SAR, ChinaHungaryIBRD onlyIcelandIDA & IBRD totalIDA blendIDA onlyIDA totalIndiaIndonesiaIran, Islamic Rep.IraqIrelandIsraelItalyJamaicaJapanJordanKazakhstanKenyaKiribatiKorea, Rep.KosovoKuwaitKyrgyz RepublicLao PDRLate-demographic dividendLatin America & Caribbean Latin America & Caribbean (excluding high income)Latin America & the Caribbean (IDA & IBRD countries)LatviaLeast developed countries: UN classificationLebanonLesothoLiberiaLibyaLithuaniaLow & middle incomeLow incomeLower middle incomeLuxembourgMacao SAR, ChinaMacedonia, FYRMadagascarMalawiMalaysiaMaldivesMaliMaltaMauritaniaMauritiusMexicoMicronesia, Fed. Sts.Middle East & North AfricaMiddle East & North Africa (excluding high income)Middle East & North Africa (IDA & IBRD countries)Middle incomeMoldovaMongoliaMontenegroMoroccoMozambiqueNamibiaNepalNetherlandsNew CaledoniaNew ZealandNicaraguaNigerNigeriaNorth AmericaNorwayOECD membersOmanOther small statesPacific island small statesPakistanPanamaPapua New GuineaParaguayPeruPhilippinesPolandPortugalPost-demographic dividendPre-demographic dividendPuerto RicoQatarRomaniaRussian FederationRwandaSaudi ArabiaSenegalSerbiaSeychellesSierra LeoneSingaporeSlovak RepublicSloveniaSmall statesSolomon IslandsSomaliaSouth AfricaSouth AsiaSouth Asia (IDA & IBRD)South SudanSpainSri LankaSt. Kitts and NevisSt. LuciaSt. Vincent and the GrenadinesSub-Saharan Africa Sub-Saharan Africa (excluding high income)Sub-Saharan Africa (IDA & IBRD countries)SudanSurinameSwazilandSwedenSwitzerlandSyrian Arab RepublicTajikistanTanzaniaThailandTimor-LesteTogoTongaTrinidad and TobagoTunisiaTurkeyTurkmenistanUgandaUkraineUnited Arab EmiratesUnited KingdomUnited StatesUpper middle incomeUruguayUzbekistanVanuatuVenezuela, RBVietnamWest Bank and GazaWorldYemen, Rep.ZambiaZimbabwe Timeline:
This timeline shows a graph from 1961 to 2016 of Bangladesh. No data until 1960. Number of actual observations by date: 56.
Source name:
World Development Indicators
Source organization:
World Bank national accounts data, and OECD National Accounts data files.
Categories, topics:
Economy & Growth
Last updated:
apr 23, 2017
Indicators value changes by year
Maximum:
28.887
jan 1, 2016
At the date of observation
Value
Absolute change
Change from previous value
jan 1, 1961
6.894
+6.894
0.0%
jan 1, 1962
7.729
+0.835
12.11%
jan 1, 1963
11.99
+4.261
55.13%
jan 1, 1964
9.856
-2.135
-17.8%
jan 1, 1965
11.975
+2.12
21.51%
jan 1, 1966
11.476
-0.499
-4.17%
jan 1, 1967
9.017
-2.459
-21.43%
jan 1, 1968
10.709
+1.692
18.76%
jan 1, 1969
14.155
+3.446
32.18%
jan 1, 1970
12.508
-1.646
-11.63%
jan 1, 1971
11.345
-1.164
-9.3%
jan 1, 1972
8.228
-3.117
-27.47%
jan 1, 1973
4.698
-3.53
-42.9%
jan 1, 1974
8.712
+4.014
85.45%
jan 1, 1975
7.375
-1.337
-15.35%
jan 1, 1976
6.148
-1.227
-16.64%
jan 1, 1977
9.911
+3.763
61.22%
jan 1, 1978
11.523
+1.612
16.26%
jan 1, 1979
11.547
+0.024
0.2%
jan 1, 1980
11.204
-0.343
-2.97%
jan 1, 1981
14.439
+3.236
28.88%
jan 1, 1982
17.156
+2.716
18.81%
jan 1, 1983
17.363
+0.208
1.21%
jan 1, 1984
16.563
-0.801
-4.61%
jan 1, 1985
16.484
-0.078
-0.47%
jan 1, 1986
15.831
-0.653
-3.96%
jan 1, 1987
16.176
+0.346
2.18%
jan 1, 1988
15.473
-0.703
-4.35%
jan 1, 1989
15.736
+0.263
1.7%
jan 1, 1990
16.121
+0.385
2.45%
jan 1, 1991
16.459
+0.338
2.1%
jan 1, 1992
16.896
+0.437
2.66%
jan 1, 1993
17.305
+0.409
2.42%
jan 1, 1994
17.947
+0.642
3.71%
jan 1, 1995
18.403
+0.456
2.54%
jan 1, 1996
19.12
+0.717
3.9%
jan 1, 1997
20.73
+1.61
8.42%
jan 1, 1998
21.816
+1.086
5.24%
jan 1, 1999
22.121
+0.305
1.4%
jan 1, 2000
22.721
+0.6
2.71%
jan 1, 2001
23.809
+1.087
4.78%
jan 1, 2002
24.174
+0.366
1.54%
jan 1, 2003
24.341
+0.167
0.69%
jan 1, 2004
24.679
+0.338
1.39%
jan 1, 2005
24.992
+0.313
1.27%
jan 1, 2006
25.83
+0.839
3.36%
jan 1, 2007
26.144
+0.314
1.21%
jan 1, 2008
26.178
+0.034
0.13%
jan 1, 2009
26.202
+0.024
0.09%
jan 1, 2010
26.206
+0.004
0.01%
jan 1, 2011
26.247
+0.041
0.15%
jan 1, 2012
27.421
+1.174
4.47%
jan 1, 2013
28.262
+0.841
3.07%
jan 1, 2014
28.39
+0.127
0.45%
jan 1, 2015
28.578
+0.188
0.66%
jan 1, 2016
28.887
+0.309
1.08%
Ranking of countries by current statistics by years


Comments: