29
/
en
AIzaSyAYiBZKx7MnpbEhh9jyipgxe19OcubqV5w
April 1, 2024
34995
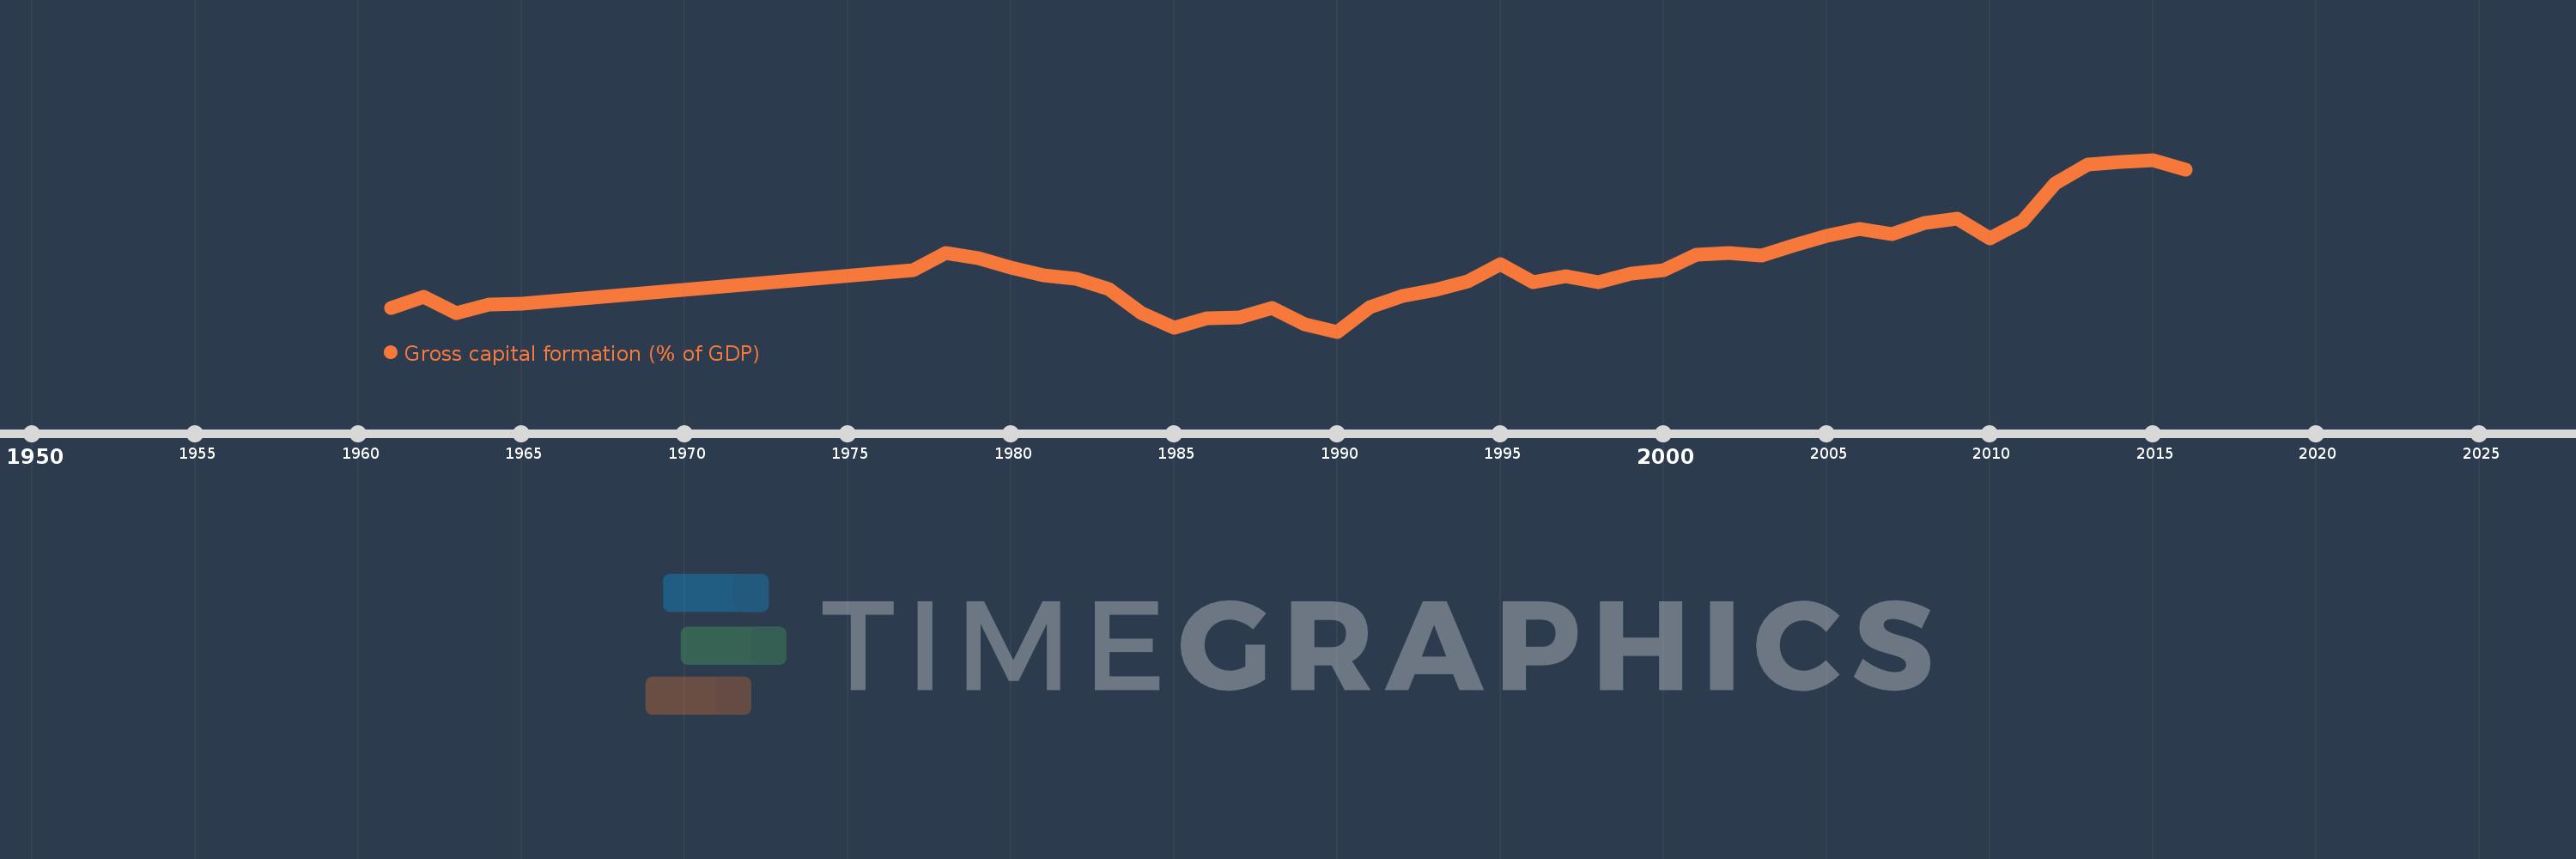
Heavily indebted poor countries (HIPC)
HPC
false
2
1
Gross capital formation (% of GDP)
2016,2015,2014,2013,2012,2011,2010,2009,2008,2007,2006,2005,2004,2003,2002,2001,2000,1999,1998,1997,1996,1995,1994,1993,1992,1991,1990,1989,1988,1987,1986,1985,1984,1983,1982,1981,1980,1979,1978,1977,1965,1964,1963,1962,1961
This statistics in other country:
AfghanistanAlbaniaAlgeriaAngolaAntigua and BarbudaArab WorldArgentinaArmeniaArubaAustraliaAustriaAzerbaijanBahamas, TheBahrainBangladeshBarbadosBelarusBelgiumBelizeBeninBermudaBhutanBoliviaBosnia and HerzegovinaBotswanaBrazilBrunei DarussalamBulgariaBurkina FasoBurundiCabo VerdeCambodiaCameroonCanadaCaribbean small statesCentral African RepublicCentral Europe and the BalticsChadChileChinaColombiaComorosCongo, Dem. Rep.Congo, Rep.Costa RicaCote d'IvoireCroatiaCubaCyprusCzech RepublicDenmarkDjiboutiDominicaDominican RepublicEarly-demographic dividendEast Asia & PacificEast Asia & Pacific (excluding high income)East Asia & Pacific (IDA & IBRD countries)EcuadorEgypt, Arab Rep.El SalvadorEquatorial GuineaEritreaEstoniaEthiopiaEuro areaEurope & Central AsiaEurope & Central Asia (excluding high income)Europe & Central Asia (IDA & IBRD countries)European UnionFaroe IslandsFijiFinlandFragile and conflict affected situationsFranceGabonGambia, TheGeorgiaGermanyGhanaGreeceGrenadaGuatemalaGuineaGuinea-BissauGuyanaHaitiHeavily indebted poor countries (HIPC)High incomeHondurasHong Kong SAR, ChinaHungaryIBRD onlyIcelandIDA & IBRD totalIDA blendIDA onlyIDA totalIndiaIndonesiaIran, Islamic Rep.IraqIrelandIsraelItalyJamaicaJapanJordanKazakhstanKenyaKiribatiKorea, Rep.KosovoKuwaitKyrgyz RepublicLao PDRLate-demographic dividendLatin America & Caribbean Latin America & Caribbean (excluding high income)Latin America & the Caribbean (IDA & IBRD countries)LatviaLeast developed countries: UN classificationLebanonLesothoLiberiaLibyaLithuaniaLow & middle incomeLow incomeLower middle incomeLuxembourgMacao SAR, ChinaMacedonia, FYRMadagascarMalawiMalaysiaMaldivesMaliMaltaMauritaniaMauritiusMexicoMicronesia, Fed. Sts.Middle East & North AfricaMiddle East & North Africa (excluding high income)Middle East & North Africa (IDA & IBRD countries)Middle incomeMoldovaMongoliaMontenegroMoroccoMozambiqueNamibiaNepalNetherlandsNew CaledoniaNew ZealandNicaraguaNigerNigeriaNorth AmericaNorwayOECD membersOmanOther small statesPacific island small statesPakistanPanamaPapua New GuineaParaguayPeruPhilippinesPolandPortugalPost-demographic dividendPre-demographic dividendPuerto RicoQatarRomaniaRussian FederationRwandaSaudi ArabiaSenegalSerbiaSeychellesSierra LeoneSingaporeSlovak RepublicSloveniaSmall statesSolomon IslandsSomaliaSouth AfricaSouth AsiaSouth Asia (IDA & IBRD)South SudanSpainSri LankaSt. Kitts and NevisSt. LuciaSt. Vincent and the GrenadinesSub-Saharan Africa Sub-Saharan Africa (excluding high income)Sub-Saharan Africa (IDA & IBRD countries)SudanSurinameSwazilandSwedenSwitzerlandSyrian Arab RepublicTajikistanTanzaniaThailandTimor-LesteTogoTongaTrinidad and TobagoTunisiaTurkeyTurkmenistanUgandaUkraineUnited Arab EmiratesUnited KingdomUnited StatesUpper middle incomeUruguayUzbekistanVanuatuVenezuela, RBVietnamWest Bank and GazaWorldYemen, Rep.ZambiaZimbabwe Timeline:
This timeline shows a graph from 1961 to 2016 of Heavily indebted poor countries (HIPC). No data until 1960. Number of actual observations by date: 45.
Source name:
World Development Indicators
Source organization:
World Bank national accounts data, and OECD National Accounts data files.
Categories, topics:
Economy & Growth
Last updated:
apr 23, 2017
Indicators value changes by year
Minimum:
12.006
jan 1, 1990
Maximum:
25.991
jan 1, 2015
At the date of observation
Value
Absolute change
Change from previous value
jan 1, 1961
13.921
+13.921
0.0%
jan 1, 1962
14.82
+0.899
6.46%
jan 1, 1963
13.516
-1.305
-8.8%
jan 1, 1964
14.198
+0.682
5.05%
jan 1, 1965
14.296
+0.098
0.69%
jan 1, 1977
17.008
+2.712
18.97%
jan 1, 1978
18.393
+1.385
8.14%
jan 1, 1979
18.001
-0.392
-2.13%
jan 1, 1980
17.201
-0.8
-4.44%
jan 1, 1981
16.552
-0.649
-3.77%
jan 1, 1982
16.293
-0.259
-1.56%
jan 1, 1983
15.49
-0.803
-4.93%
jan 1, 1984
13.502
-1.988
-12.84%
jan 1, 1985
12.303
-1.198
-8.88%
jan 1, 1986
13.069
+0.765
6.22%
jan 1, 1987
13.136
+0.067
0.51%
jan 1, 1988
13.916
+0.78
5.94%
jan 1, 1989
12.603
-1.312
-9.43%
jan 1, 1990
12.006
-0.598
-4.74%
jan 1, 1991
13.974
+1.969
16.4%
jan 1, 1992
14.902
+0.927
6.64%
jan 1, 1993
15.374
+0.472
3.17%
jan 1, 1994
16.127
+0.753
4.89%
jan 1, 1995
17.472
+1.345
8.34%
jan 1, 1996
16.028
-1.444
-8.26%
jan 1, 1997
16.514
+0.486
3.03%
jan 1, 1998
16.029
-0.485
-2.93%
jan 1, 1999
16.727
+0.698
4.35%
jan 1, 2000
16.997
+0.271
1.62%
jan 1, 2001
18.25
+1.252
7.37%
jan 1, 2002
18.433
+0.183
1.0%
jan 1, 2003
18.211
-0.222
-1.2%
jan 1, 2004
19.059
+0.847
4.65%
jan 1, 2005
19.837
+0.778
4.08%
jan 1, 2006
20.353
+0.516
2.6%
jan 1, 2007
19.922
-0.431
-2.12%
jan 1, 2008
20.841
+0.919
4.61%
jan 1, 2009
21.208
+0.367
1.76%
jan 1, 2010
19.617
-1.591
-7.5%
jan 1, 2011
21.014
+1.397
7.12%
jan 1, 2012
24.08
+3.067
14.59%
jan 1, 2013
25.575
+1.495
6.21%
jan 1, 2014
25.846
+0.271
1.06%
jan 1, 2015
25.991
+0.144
0.56%
jan 1, 2016
25.219
-0.772
-2.97%
Ranking of countries by current statistics by years


Comments: