29
/
en
AIzaSyAYiBZKx7MnpbEhh9jyipgxe19OcubqV5w
April 1, 2024
127385
Equatorial Guinea
GNQ
true
2
1
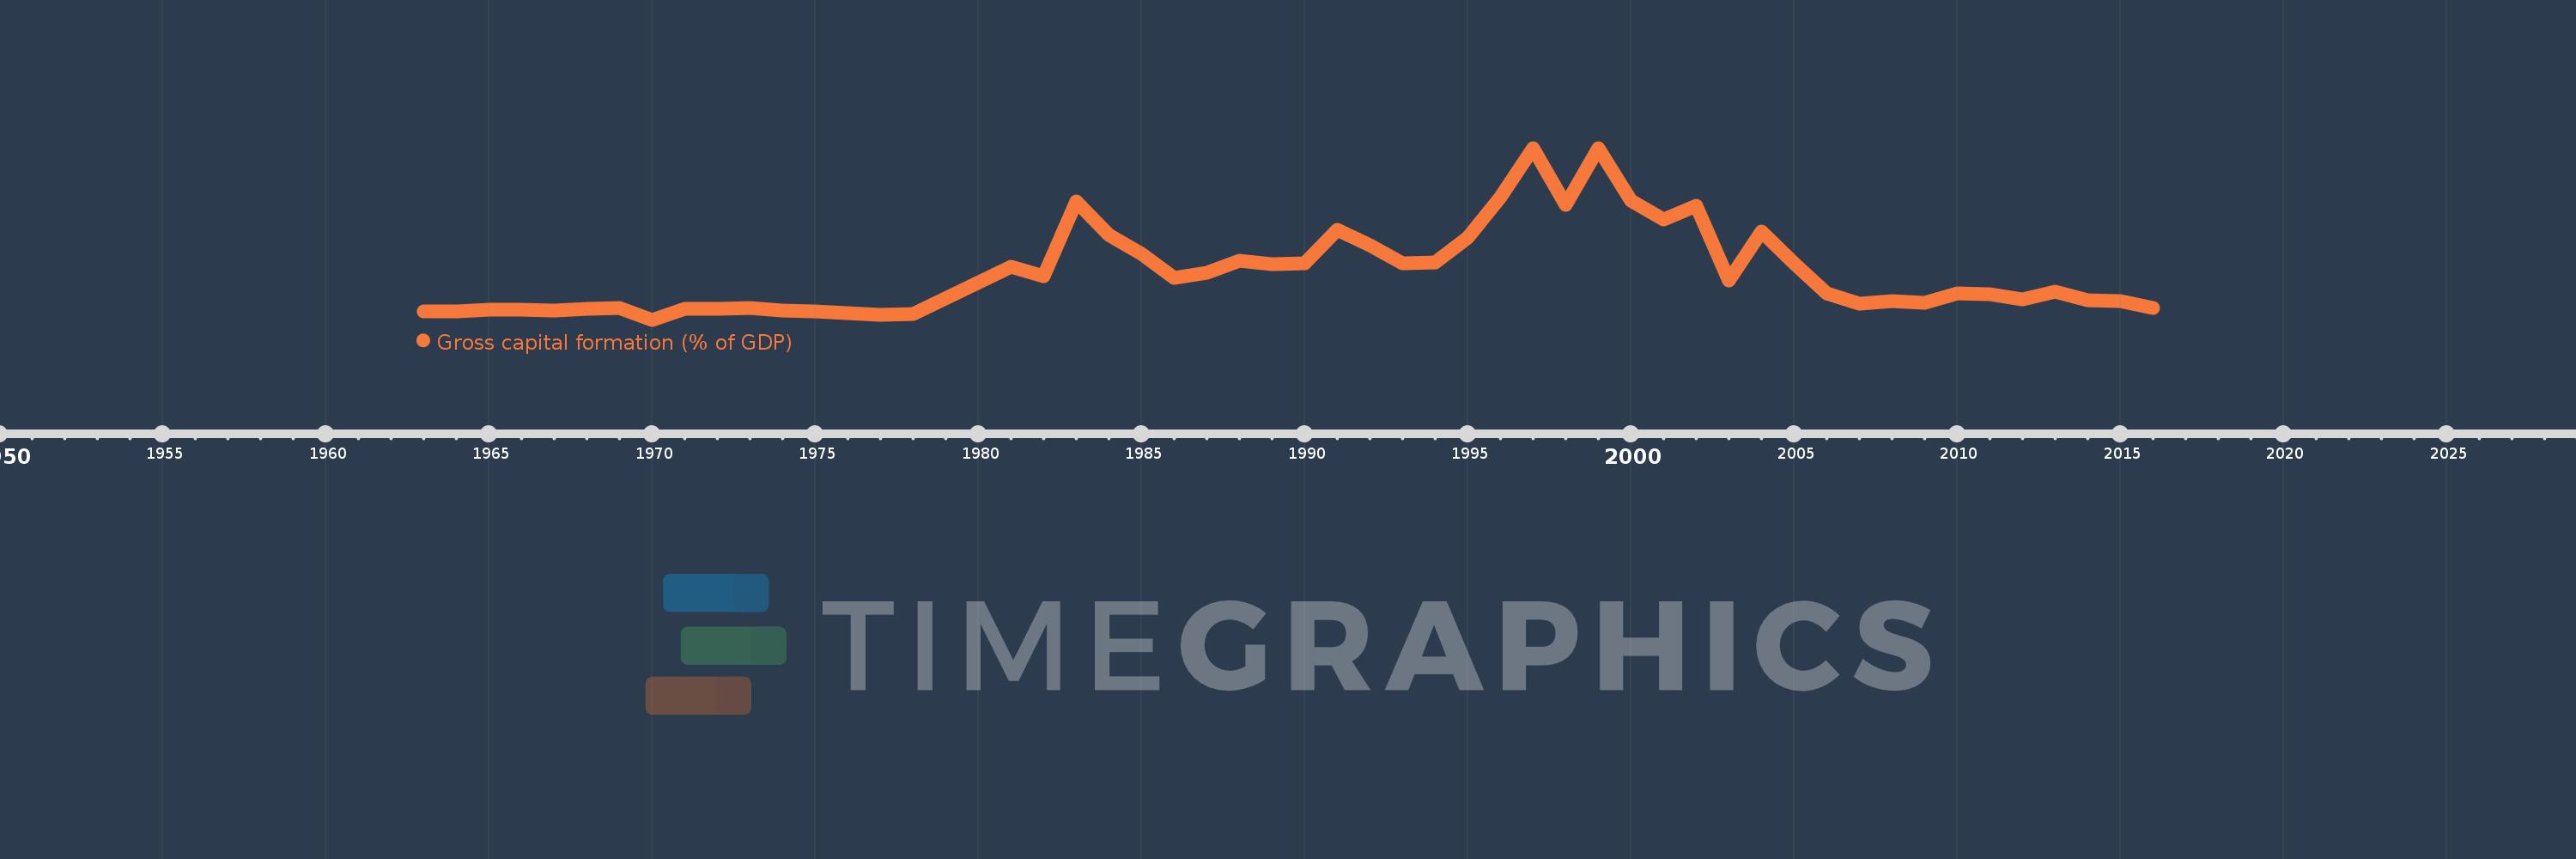
Gross capital formation (% of GDP)
2016,2015,2014,2013,2012,2011,2010,2009,2008,2007,2006,2005,2004,2003,2002,2001,2000,1999,1998,1997,1996,1995,1994,1993,1992,1991,1990,1989,1988,1987,1986,1985,1984,1983,1982,1981,1978,1977,1976,1975,1974,1973,1972,1971,1970,1969,1968,1967,1966,1965,1964,1963
This statistics in other country:
AfghanistanAlbaniaAlgeriaAngolaAntigua and BarbudaArab WorldArgentinaArmeniaArubaAustraliaAustriaAzerbaijanBahamas, TheBahrainBangladeshBarbadosBelarusBelgiumBelizeBeninBermudaBhutanBoliviaBosnia and HerzegovinaBotswanaBrazilBrunei DarussalamBulgariaBurkina FasoBurundiCabo VerdeCambodiaCameroonCanadaCaribbean small statesCentral African RepublicCentral Europe and the BalticsChadChileChinaColombiaComorosCongo, Dem. Rep.Congo, Rep.Costa RicaCote d'IvoireCroatiaCubaCyprusCzech RepublicDenmarkDjiboutiDominicaDominican RepublicEarly-demographic dividendEast Asia & PacificEast Asia & Pacific (excluding high income)East Asia & Pacific (IDA & IBRD countries)EcuadorEgypt, Arab Rep.El SalvadorEquatorial GuineaEritreaEstoniaEthiopiaEuro areaEurope & Central AsiaEurope & Central Asia (excluding high income)Europe & Central Asia (IDA & IBRD countries)European UnionFaroe IslandsFijiFinlandFragile and conflict affected situationsFranceGabonGambia, TheGeorgiaGermanyGhanaGreeceGrenadaGuatemalaGuineaGuinea-BissauGuyanaHaitiHeavily indebted poor countries (HIPC)High incomeHondurasHong Kong SAR, ChinaHungaryIBRD onlyIcelandIDA & IBRD totalIDA blendIDA onlyIDA totalIndiaIndonesiaIran, Islamic Rep.IraqIrelandIsraelItalyJamaicaJapanJordanKazakhstanKenyaKiribatiKorea, Rep.KosovoKuwaitKyrgyz RepublicLao PDRLate-demographic dividendLatin America & Caribbean Latin America & Caribbean (excluding high income)Latin America & the Caribbean (IDA & IBRD countries)LatviaLeast developed countries: UN classificationLebanonLesothoLiberiaLibyaLithuaniaLow & middle incomeLow incomeLower middle incomeLuxembourgMacao SAR, ChinaMacedonia, FYRMadagascarMalawiMalaysiaMaldivesMaliMaltaMauritaniaMauritiusMexicoMicronesia, Fed. Sts.Middle East & North AfricaMiddle East & North Africa (excluding high income)Middle East & North Africa (IDA & IBRD countries)Middle incomeMoldovaMongoliaMontenegroMoroccoMozambiqueNamibiaNepalNetherlandsNew CaledoniaNew ZealandNicaraguaNigerNigeriaNorth AmericaNorwayOECD membersOmanOther small statesPacific island small statesPakistanPanamaPapua New GuineaParaguayPeruPhilippinesPolandPortugalPost-demographic dividendPre-demographic dividendPuerto RicoQatarRomaniaRussian FederationRwandaSaudi ArabiaSenegalSerbiaSeychellesSierra LeoneSingaporeSlovak RepublicSloveniaSmall statesSolomon IslandsSomaliaSouth AfricaSouth AsiaSouth Asia (IDA & IBRD)South SudanSpainSri LankaSt. Kitts and NevisSt. LuciaSt. Vincent and the GrenadinesSub-Saharan Africa Sub-Saharan Africa (excluding high income)Sub-Saharan Africa (IDA & IBRD countries)SudanSurinameSwazilandSwedenSwitzerlandSyrian Arab RepublicTajikistanTanzaniaThailandTimor-LesteTogoTongaTrinidad and TobagoTunisiaTurkeyTurkmenistanUgandaUkraineUnited Arab EmiratesUnited KingdomUnited StatesUpper middle incomeUruguayUzbekistanVanuatuVenezuela, RBVietnamWest Bank and GazaWorldYemen, Rep.ZambiaZimbabwe Timeline:
This timeline shows a graph from 1963 to 2016 of Equatorial Guinea. No data until 1962. Number of actual observations by date: 52.
Source name:
World Development Indicators
Source organization:
World Bank national accounts data, and OECD National Accounts data files.
Categories, topics:
Economy & Growth
Last updated:
apr 23, 2017
Indicators value changes by year
Maximum:
219.069
jan 1, 1997
At the date of observation
Value
Absolute change
Change from previous value
jan 1, 1963
16.509
+16.509
0.0%
jan 1, 1964
17.357
+0.848
5.14%
jan 1, 1965
18.909
+1.552
8.94%
jan 1, 1966
18.636
-0.273
-1.44%
jan 1, 1967
18.352
-0.284
-1.52%
jan 1, 1968
20.428
+2.075
11.31%
jan 1, 1969
20.8
+0.372
1.82%
jan 1, 1970
6.715
-14.085
-67.72%
jan 1, 1971
19.879
+13.163
196.03%
jan 1, 1972
20.391
+0.512
2.58%
jan 1, 1973
20.831
+0.44
2.16%
jan 1, 1974
18.037
-2.795
-13.42%
jan 1, 1975
16.634
-1.403
-7.78%
jan 1, 1976
14.982
-1.652
-9.93%
jan 1, 1977
13.169
-1.813
-12.1%
jan 1, 1978
13.488
+0.319
2.42%
jan 1, 1981
72.439
+58.951
437.08%
jan 1, 1982
60.326
-12.112
-16.72%
jan 1, 1983
153.447
+93.121
154.36%
jan 1, 1984
111.671
-41.776
-27.23%
jan 1, 1985
88.257
-23.415
-20.97%
jan 1, 1986
58.887
-29.369
-33.28%
jan 1, 1987
64.278
+5.39
9.15%
jan 1, 1988
79.315
+15.037
23.39%
jan 1, 1989
75.642
-3.672
-4.63%
jan 1, 1990
76.208
+0.566
0.75%
jan 1, 1991
117.861
+41.653
54.66%
jan 1, 1992
99.037
-18.824
-15.97%
jan 1, 1993
76.018
-23.019
-23.24%
jan 1, 1994
78.064
+2.046
2.69%
jan 1, 1995
108.641
+30.577
39.17%
jan 1, 1996
158.507
+49.865
45.9%
jan 1, 1997
219.069
+60.563
38.21%
jan 1, 1998
148.29
-70.78
-32.31%
jan 1, 1999
218.986
+70.696
47.67%
jan 1, 2000
154.468
-64.518
-29.46%
jan 1, 2001
131.05
-23.418
-15.16%
jan 1, 2002
147.879
+16.829
12.84%
jan 1, 2003
55.686
-92.193
-62.34%
jan 1, 2004
116.204
+60.518
108.68%
jan 1, 2005
76.999
-39.205
-33.74%
jan 1, 2006
39.477
-37.523
-48.73%
jan 1, 2007
26.501
-12.976
-32.87%
jan 1, 2008
29.586
+3.085
11.64%
jan 1, 2009
27.542
-2.044
-6.91%
jan 1, 2010
39.393
+11.851
43.03%
jan 1, 2011
38.056
-1.337
-3.39%
jan 1, 2012
32.049
-6.007
-15.78%
jan 1, 2013
41.148
+9.099
28.39%
jan 1, 2014
30.308
-10.84
-26.34%
jan 1, 2015
29.532
-0.777
-2.56%
jan 1, 2016
21.701
-7.83
-26.52%
Ranking of countries by current statistics by years


Comments: