29
/
en
AIzaSyAYiBZKx7MnpbEhh9jyipgxe19OcubqV5w
April 1, 2024
135561
Gabon
GAB
true
2
1
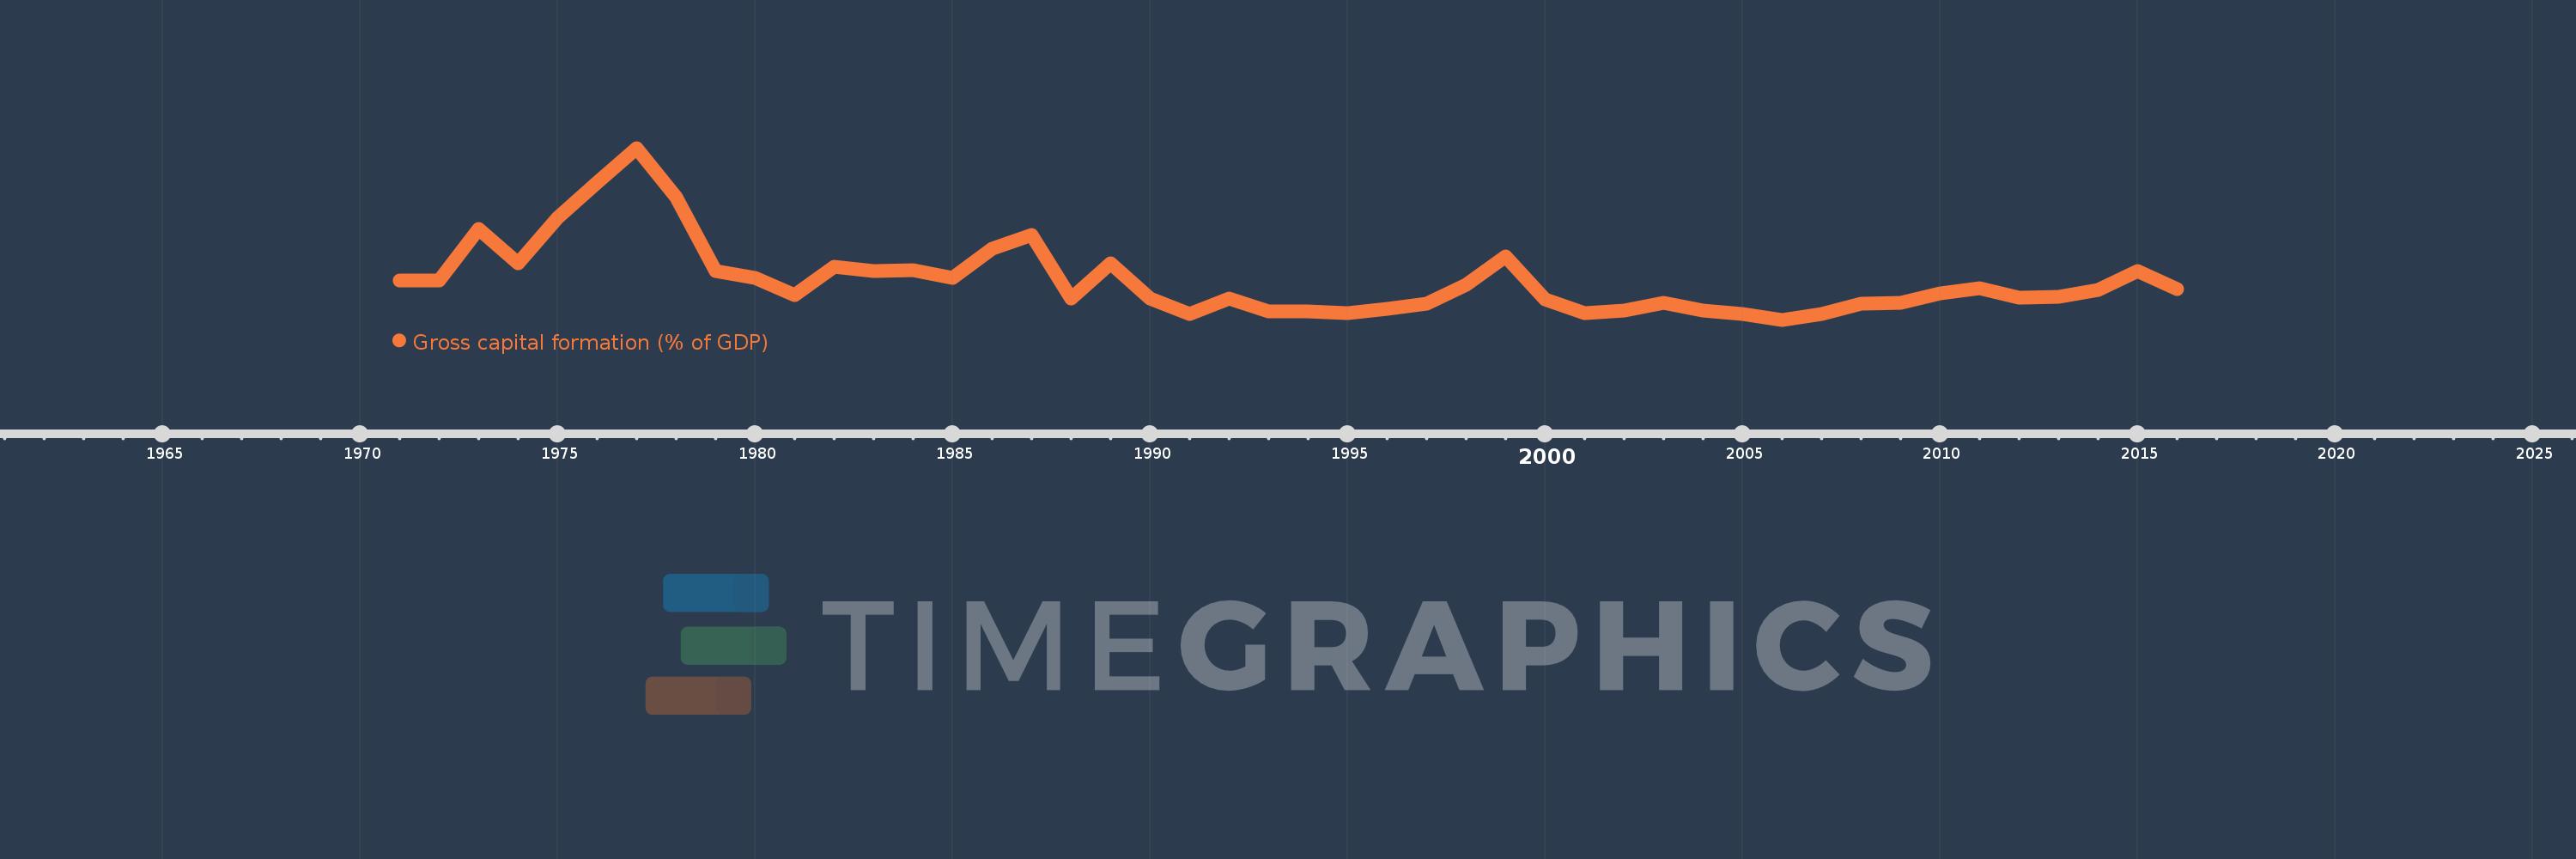
Gross capital formation (% of GDP)
2016,2015,2014,2013,2012,2011,2010,2009,2008,2007,2006,2005,2004,2003,2002,2001,2000,1999,1998,1997,1996,1995,1994,1993,1992,1991,1990,1989,1988,1987,1986,1985,1984,1983,1982,1981,1980,1979,1978,1977,1976,1975,1974,1973,1972,1971
This statistics in other country:
AfghanistanAlbaniaAlgeriaAngolaAntigua and BarbudaArab WorldArgentinaArmeniaArubaAustraliaAustriaAzerbaijanBahamas, TheBahrainBangladeshBarbadosBelarusBelgiumBelizeBeninBermudaBhutanBoliviaBosnia and HerzegovinaBotswanaBrazilBrunei DarussalamBulgariaBurkina FasoBurundiCabo VerdeCambodiaCameroonCanadaCaribbean small statesCentral African RepublicCentral Europe and the BalticsChadChileChinaColombiaComorosCongo, Dem. Rep.Congo, Rep.Costa RicaCote d'IvoireCroatiaCubaCyprusCzech RepublicDenmarkDjiboutiDominicaDominican RepublicEarly-demographic dividendEast Asia & PacificEast Asia & Pacific (excluding high income)East Asia & Pacific (IDA & IBRD countries)EcuadorEgypt, Arab Rep.El SalvadorEquatorial GuineaEritreaEstoniaEthiopiaEuro areaEurope & Central AsiaEurope & Central Asia (excluding high income)Europe & Central Asia (IDA & IBRD countries)European UnionFaroe IslandsFijiFinlandFragile and conflict affected situationsFranceGabonGambia, TheGeorgiaGermanyGhanaGreeceGrenadaGuatemalaGuineaGuinea-BissauGuyanaHaitiHeavily indebted poor countries (HIPC)High incomeHondurasHong Kong SAR, ChinaHungaryIBRD onlyIcelandIDA & IBRD totalIDA blendIDA onlyIDA totalIndiaIndonesiaIran, Islamic Rep.IraqIrelandIsraelItalyJamaicaJapanJordanKazakhstanKenyaKiribatiKorea, Rep.KosovoKuwaitKyrgyz RepublicLao PDRLate-demographic dividendLatin America & Caribbean Latin America & Caribbean (excluding high income)Latin America & the Caribbean (IDA & IBRD countries)LatviaLeast developed countries: UN classificationLebanonLesothoLiberiaLibyaLithuaniaLow & middle incomeLow incomeLower middle incomeLuxembourgMacao SAR, ChinaMacedonia, FYRMadagascarMalawiMalaysiaMaldivesMaliMaltaMauritaniaMauritiusMexicoMicronesia, Fed. Sts.Middle East & North AfricaMiddle East & North Africa (excluding high income)Middle East & North Africa (IDA & IBRD countries)Middle incomeMoldovaMongoliaMontenegroMoroccoMozambiqueNamibiaNepalNetherlandsNew CaledoniaNew ZealandNicaraguaNigerNigeriaNorth AmericaNorwayOECD membersOmanOther small statesPacific island small statesPakistanPanamaPapua New GuineaParaguayPeruPhilippinesPolandPortugalPost-demographic dividendPre-demographic dividendPuerto RicoQatarRomaniaRussian FederationRwandaSaudi ArabiaSenegalSerbiaSeychellesSierra LeoneSingaporeSlovak RepublicSloveniaSmall statesSolomon IslandsSomaliaSouth AfricaSouth AsiaSouth Asia (IDA & IBRD)South SudanSpainSri LankaSt. Kitts and NevisSt. LuciaSt. Vincent and the GrenadinesSub-Saharan Africa Sub-Saharan Africa (excluding high income)Sub-Saharan Africa (IDA & IBRD countries)SudanSurinameSwazilandSwedenSwitzerlandSyrian Arab RepublicTajikistanTanzaniaThailandTimor-LesteTogoTongaTrinidad and TobagoTunisiaTurkeyTurkmenistanUgandaUkraineUnited Arab EmiratesUnited KingdomUnited StatesUpper middle incomeUruguayUzbekistanVanuatuVenezuela, RBVietnamWest Bank and GazaWorldYemen, Rep.ZambiaZimbabwe Timeline:
This timeline shows a graph from 1971 to 2016 of Gabon. No data until 1970. Number of actual observations by date: 46.
Source name:
World Development Indicators
Source organization:
World Bank national accounts data, and OECD National Accounts data files.
Categories, topics:
Economy & Growth
Last updated:
apr 23, 2017
Indicators value changes by year
Minimum:
19.783
jan 1, 2006
Maximum:
73.495
jan 1, 1977
At the date of observation
Value
Absolute change
Change from previous value
jan 1, 1971
31.955
+31.955
0.0%
jan 1, 1972
31.97
+0.014
0.04%
jan 1, 1973
48.111
+16.141
50.49%
jan 1, 1974
37.554
-10.556
-21.94%
jan 1, 1975
51.762
+14.208
37.83%
jan 1, 1976
62.673
+10.911
21.08%
jan 1, 1977
73.495
+10.822
17.27%
jan 1, 1978
58.07
-15.425
-20.99%
jan 1, 1979
35.015
-23.055
-39.7%
jan 1, 1980
32.92
-2.095
-5.98%
jan 1, 1981
27.538
-5.381
-16.35%
jan 1, 1982
36.351
+8.812
32.0%
jan 1, 1983
35.016
-1.335
-3.67%
jan 1, 1984
35.185
+0.17
0.48%
jan 1, 1985
32.965
-2.22
-6.31%
jan 1, 1986
41.993
+9.028
27.39%
jan 1, 1987
46.365
+4.372
10.41%
jan 1, 1988
26.361
-20.003
-43.14%
jan 1, 1989
37.475
+11.114
42.16%
jan 1, 1990
26.305
-11.17
-29.81%
jan 1, 1991
21.677
-4.628
-17.59%
jan 1, 1992
26.468
+4.791
22.1%
jan 1, 1993
22.425
-4.043
-15.27%
jan 1, 1994
22.449
+0.023
0.1%
jan 1, 1995
21.868
-0.581
-2.59%
jan 1, 1996
23.303
+1.436
6.56%
jan 1, 1997
24.849
+1.546
6.63%
jan 1, 1998
30.761
+5.912
23.79%
jan 1, 1999
39.558
+8.796
28.6%
jan 1, 2000
26.169
-13.389
-33.85%
jan 1, 2001
21.902
-4.267
-16.3%
jan 1, 2002
22.745
+0.843
3.85%
jan 1, 2003
25.107
+2.362
10.38%
jan 1, 2004
22.639
-2.468
-9.83%
jan 1, 2005
21.496
-1.143
-5.05%
jan 1, 2006
19.783
-1.713
-7.97%
jan 1, 2007
21.637
+1.854
9.37%
jan 1, 2008
24.879
+3.241
14.98%
jan 1, 2009
25.027
+0.148
0.6%
jan 1, 2010
27.981
+2.954
11.8%
jan 1, 2011
29.701
+1.72
6.15%
jan 1, 2012
26.642
-3.059
-10.3%
jan 1, 2013
26.966
+0.324
1.22%
jan 1, 2014
29.18
+2.214
8.21%
jan 1, 2015
35.139
+5.958
20.42%
jan 1, 2016
29.498
-5.64
-16.05%
Ranking of countries by current statistics by years


Comments: