29
/
en
AIzaSyAYiBZKx7MnpbEhh9jyipgxe19OcubqV5w
April 1, 2024
256378
Sweden
SWE
true
2
1
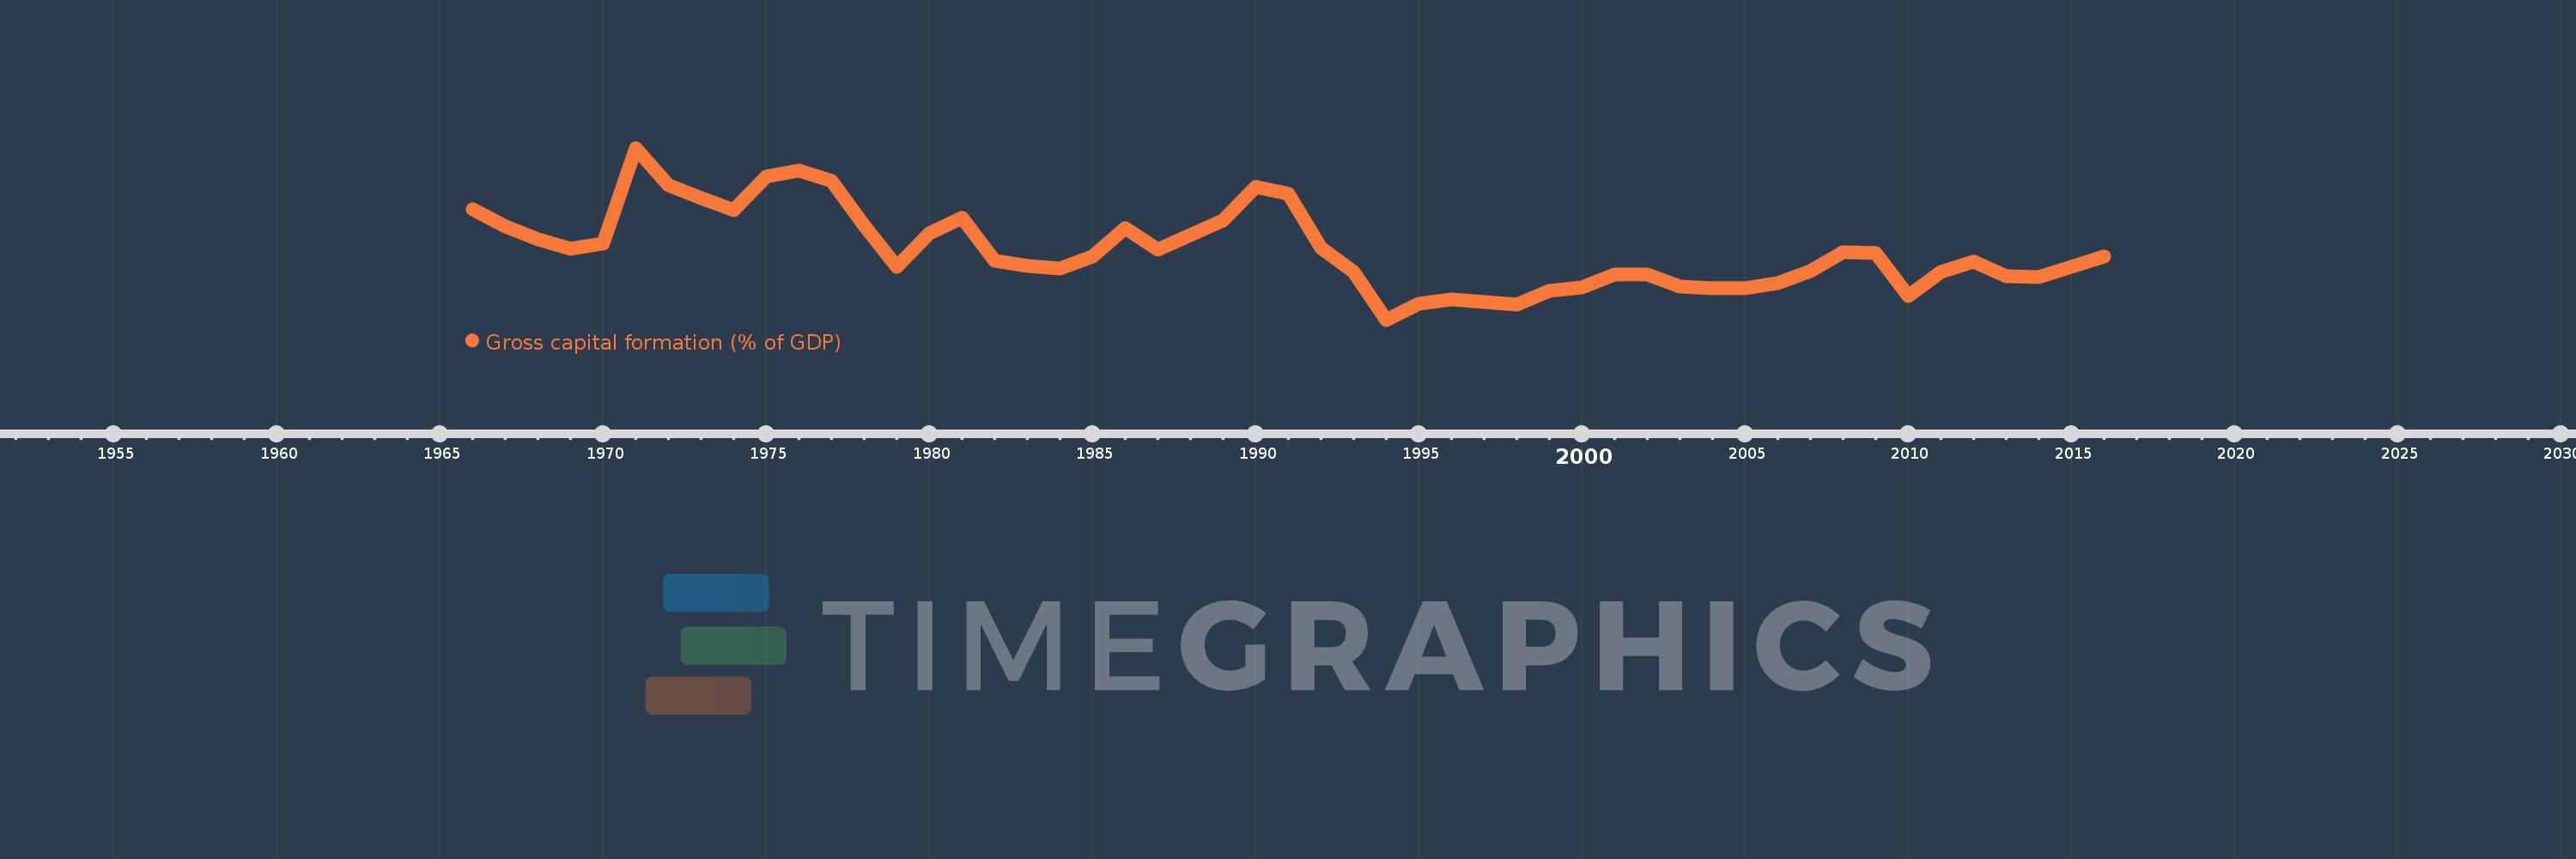
Gross capital formation (% of GDP)
2016,2015,2014,2013,2012,2011,2010,2009,2008,2007,2006,2005,2004,2003,2002,2001,2000,1999,1998,1997,1996,1995,1994,1993,1992,1991,1990,1989,1988,1987,1986,1985,1984,1983,1982,1981,1980,1979,1978,1977,1976,1975,1974,1973,1972,1971,1970,1969,1968,1967,1966
This statistics in other country:
AfghanistanAlbaniaAlgeriaAngolaAntigua and BarbudaArab WorldArgentinaArmeniaArubaAustraliaAustriaAzerbaijanBahamas, TheBahrainBangladeshBarbadosBelarusBelgiumBelizeBeninBermudaBhutanBoliviaBosnia and HerzegovinaBotswanaBrazilBrunei DarussalamBulgariaBurkina FasoBurundiCabo VerdeCambodiaCameroonCanadaCaribbean small statesCentral African RepublicCentral Europe and the BalticsChadChileChinaColombiaComorosCongo, Dem. Rep.Congo, Rep.Costa RicaCote d'IvoireCroatiaCubaCyprusCzech RepublicDenmarkDjiboutiDominicaDominican RepublicEarly-demographic dividendEast Asia & PacificEast Asia & Pacific (excluding high income)East Asia & Pacific (IDA & IBRD countries)EcuadorEgypt, Arab Rep.El SalvadorEquatorial GuineaEritreaEstoniaEthiopiaEuro areaEurope & Central AsiaEurope & Central Asia (excluding high income)Europe & Central Asia (IDA & IBRD countries)European UnionFaroe IslandsFijiFinlandFragile and conflict affected situationsFranceGabonGambia, TheGeorgiaGermanyGhanaGreeceGrenadaGuatemalaGuineaGuinea-BissauGuyanaHaitiHeavily indebted poor countries (HIPC)High incomeHondurasHong Kong SAR, ChinaHungaryIBRD onlyIcelandIDA & IBRD totalIDA blendIDA onlyIDA totalIndiaIndonesiaIran, Islamic Rep.IraqIrelandIsraelItalyJamaicaJapanJordanKazakhstanKenyaKiribatiKorea, Rep.KosovoKuwaitKyrgyz RepublicLao PDRLate-demographic dividendLatin America & Caribbean Latin America & Caribbean (excluding high income)Latin America & the Caribbean (IDA & IBRD countries)LatviaLeast developed countries: UN classificationLebanonLesothoLiberiaLibyaLithuaniaLow & middle incomeLow incomeLower middle incomeLuxembourgMacao SAR, ChinaMacedonia, FYRMadagascarMalawiMalaysiaMaldivesMaliMaltaMauritaniaMauritiusMexicoMicronesia, Fed. Sts.Middle East & North AfricaMiddle East & North Africa (excluding high income)Middle East & North Africa (IDA & IBRD countries)Middle incomeMoldovaMongoliaMontenegroMoroccoMozambiqueNamibiaNepalNetherlandsNew CaledoniaNew ZealandNicaraguaNigerNigeriaNorth AmericaNorwayOECD membersOmanOther small statesPacific island small statesPakistanPanamaPapua New GuineaParaguayPeruPhilippinesPolandPortugalPost-demographic dividendPre-demographic dividendPuerto RicoQatarRomaniaRussian FederationRwandaSaudi ArabiaSenegalSerbiaSeychellesSierra LeoneSingaporeSlovak RepublicSloveniaSmall statesSolomon IslandsSomaliaSouth AfricaSouth AsiaSouth Asia (IDA & IBRD)South SudanSpainSri LankaSt. Kitts and NevisSt. LuciaSt. Vincent and the GrenadinesSub-Saharan Africa Sub-Saharan Africa (excluding high income)Sub-Saharan Africa (IDA & IBRD countries)SudanSurinameSwazilandSwedenSwitzerlandSyrian Arab RepublicTajikistanTanzaniaThailandTimor-LesteTogoTongaTrinidad and TobagoTunisiaTurkeyTurkmenistanUgandaUkraineUnited Arab EmiratesUnited KingdomUnited StatesUpper middle incomeUruguayUzbekistanVanuatuVenezuela, RBVietnamWest Bank and GazaWorldYemen, Rep.ZambiaZimbabwe Timeline:
This timeline shows a graph from 1966 to 2016 of Sweden. No data until 1965. Number of actual observations by date: 51.
Source name:
World Development Indicators
Source organization:
World Bank national accounts data, and OECD National Accounts data files.
Categories, topics:
Economy & Growth
Last updated:
apr 23, 2017
Indicators value changes by year
Minimum:
18.949
jan 1, 1994
Maximum:
33.305
jan 1, 1971
At the date of observation
Value
Absolute change
Change from previous value
jan 1, 1966
28.219
+28.219
0.0%
jan 1, 1967
26.732
-1.487
-5.27%
jan 1, 1968
25.652
-1.08
-4.04%
jan 1, 1969
24.854
-0.798
-3.11%
jan 1, 1970
25.337
+0.483
1.94%
jan 1, 1971
33.305
+7.969
31.45%
jan 1, 1972
30.209
-3.097
-9.3%
jan 1, 1973
29.135
-1.074
-3.55%
jan 1, 1974
28.133
-1.002
-3.44%
jan 1, 1975
30.913
+2.781
9.88%
jan 1, 1976
31.435
+0.522
1.69%
jan 1, 1977
30.534
-0.901
-2.87%
jan 1, 1978
26.821
-3.713
-12.16%
jan 1, 1979
23.387
-3.434
-12.8%
jan 1, 1980
26.143
+2.756
11.79%
jan 1, 1981
27.492
+1.349
5.16%
jan 1, 1982
23.863
-3.629
-13.2%
jan 1, 1983
23.424
-0.439
-1.84%
jan 1, 1984
23.255
-0.169
-0.72%
jan 1, 1985
24.247
+0.992
4.26%
jan 1, 1986
26.598
+2.351
9.69%
jan 1, 1987
24.814
-1.784
-6.71%
jan 1, 1988
26.016
+1.202
4.85%
jan 1, 1989
27.264
+1.248
4.8%
jan 1, 1990
30.037
+2.773
10.17%
jan 1, 1991
29.461
-0.576
-1.92%
jan 1, 1992
24.952
-4.509
-15.3%
jan 1, 1993
22.944
-2.008
-8.05%
jan 1, 1994
18.949
-3.995
-17.41%
jan 1, 1995
20.256
+1.307
6.9%
jan 1, 1996
20.654
+0.397
1.96%
jan 1, 1997
20.405
-0.248
-1.2%
jan 1, 1998
20.217
-0.188
-0.92%
jan 1, 1999
21.336
+1.12
5.54%
jan 1, 2000
21.628
+0.291
1.36%
jan 1, 2001
22.754
+1.127
5.21%
jan 1, 2002
22.75
-0.004
-0.02%
jan 1, 2003
21.741
-1.009
-4.44%
jan 1, 2004
21.574
-0.167
-0.77%
jan 1, 2005
21.558
-0.017
-0.08%
jan 1, 2006
22.004
+0.446
2.07%
jan 1, 2007
23.027
+1.023
4.65%
jan 1, 2008
24.609
+1.582
6.87%
jan 1, 2009
24.52
-0.089
-0.36%
jan 1, 2010
20.924
-3.596
-14.66%
jan 1, 2011
22.913
+1.989
9.5%
jan 1, 2012
23.816
+0.903
3.94%
jan 1, 2013
22.611
-1.205
-5.06%
jan 1, 2014
22.495
-0.116
-0.51%
jan 1, 2015
23.35
+0.855
3.8%
jan 1, 2016
24.241
+0.891
3.81%
Ranking of countries by current statistics by years


Comments: