29
/
en
AIzaSyAYiBZKx7MnpbEhh9jyipgxe19OcubqV5w
April 1, 2024
235814
Senegal
SEN
true
2
1
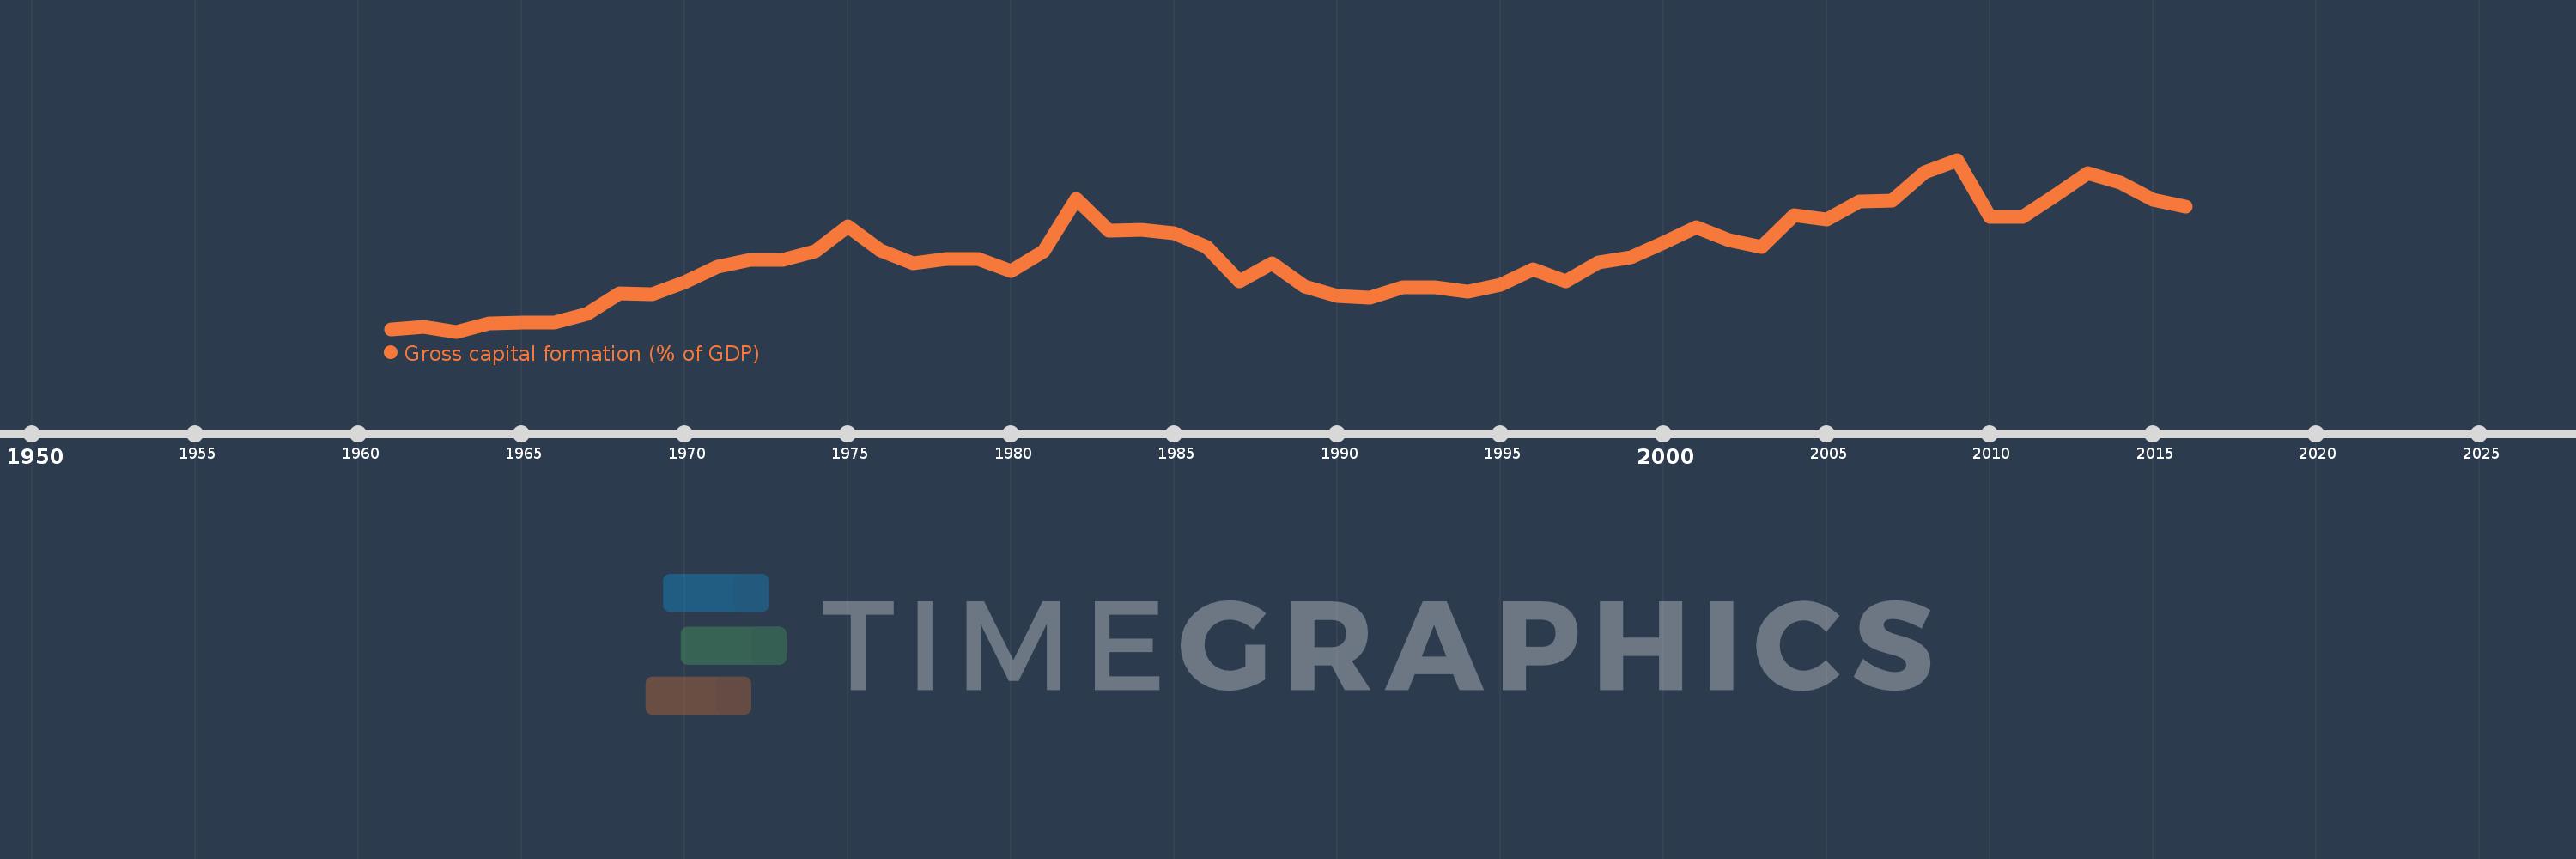
Gross capital formation (% of GDP)
2016,2015,2014,2013,2012,2011,2010,2009,2008,2007,2006,2005,2004,2003,2002,2001,2000,1999,1998,1997,1996,1995,1994,1993,1992,1991,1990,1989,1988,1987,1986,1985,1984,1983,1982,1981,1980,1979,1978,1977,1976,1975,1974,1973,1972,1971,1970,1969,1968,1967,1966,1965,1964,1963,1962,1961
This statistics in other country:
AfghanistanAlbaniaAlgeriaAngolaAntigua and BarbudaArab WorldArgentinaArmeniaArubaAustraliaAustriaAzerbaijanBahamas, TheBahrainBangladeshBarbadosBelarusBelgiumBelizeBeninBermudaBhutanBoliviaBosnia and HerzegovinaBotswanaBrazilBrunei DarussalamBulgariaBurkina FasoBurundiCabo VerdeCambodiaCameroonCanadaCaribbean small statesCentral African RepublicCentral Europe and the BalticsChadChileChinaColombiaComorosCongo, Dem. Rep.Congo, Rep.Costa RicaCote d'IvoireCroatiaCubaCyprusCzech RepublicDenmarkDjiboutiDominicaDominican RepublicEarly-demographic dividendEast Asia & PacificEast Asia & Pacific (excluding high income)East Asia & Pacific (IDA & IBRD countries)EcuadorEgypt, Arab Rep.El SalvadorEquatorial GuineaEritreaEstoniaEthiopiaEuro areaEurope & Central AsiaEurope & Central Asia (excluding high income)Europe & Central Asia (IDA & IBRD countries)European UnionFaroe IslandsFijiFinlandFragile and conflict affected situationsFranceGabonGambia, TheGeorgiaGermanyGhanaGreeceGrenadaGuatemalaGuineaGuinea-BissauGuyanaHaitiHeavily indebted poor countries (HIPC)High incomeHondurasHong Kong SAR, ChinaHungaryIBRD onlyIcelandIDA & IBRD totalIDA blendIDA onlyIDA totalIndiaIndonesiaIran, Islamic Rep.IraqIrelandIsraelItalyJamaicaJapanJordanKazakhstanKenyaKiribatiKorea, Rep.KosovoKuwaitKyrgyz RepublicLao PDRLate-demographic dividendLatin America & Caribbean Latin America & Caribbean (excluding high income)Latin America & the Caribbean (IDA & IBRD countries)LatviaLeast developed countries: UN classificationLebanonLesothoLiberiaLibyaLithuaniaLow & middle incomeLow incomeLower middle incomeLuxembourgMacao SAR, ChinaMacedonia, FYRMadagascarMalawiMalaysiaMaldivesMaliMaltaMauritaniaMauritiusMexicoMicronesia, Fed. Sts.Middle East & North AfricaMiddle East & North Africa (excluding high income)Middle East & North Africa (IDA & IBRD countries)Middle incomeMoldovaMongoliaMontenegroMoroccoMozambiqueNamibiaNepalNetherlandsNew CaledoniaNew ZealandNicaraguaNigerNigeriaNorth AmericaNorwayOECD membersOmanOther small statesPacific island small statesPakistanPanamaPapua New GuineaParaguayPeruPhilippinesPolandPortugalPost-demographic dividendPre-demographic dividendPuerto RicoQatarRomaniaRussian FederationRwandaSaudi ArabiaSenegalSerbiaSeychellesSierra LeoneSingaporeSlovak RepublicSloveniaSmall statesSolomon IslandsSomaliaSouth AfricaSouth AsiaSouth Asia (IDA & IBRD)South SudanSpainSri LankaSt. Kitts and NevisSt. LuciaSt. Vincent and the GrenadinesSub-Saharan Africa Sub-Saharan Africa (excluding high income)Sub-Saharan Africa (IDA & IBRD countries)SudanSurinameSwazilandSwedenSwitzerlandSyrian Arab RepublicTajikistanTanzaniaThailandTimor-LesteTogoTongaTrinidad and TobagoTunisiaTurkeyTurkmenistanUgandaUkraineUnited Arab EmiratesUnited KingdomUnited StatesUpper middle incomeUruguayUzbekistanVanuatuVenezuela, RBVietnamWest Bank and GazaWorldYemen, Rep.ZambiaZimbabwe Timeline:
This timeline shows a graph from 1961 to 2016 of Senegal. No data until 1960. Number of actual observations by date: 56.
Source name:
World Development Indicators
Source organization:
World Bank national accounts data, and OECD National Accounts data files.
Categories, topics:
Economy & Growth
Last updated:
apr 23, 2017
Indicators value changes by year
At the date of observation
Value
Absolute change
Change from previous value
jan 1, 1961
3.941
+3.941
0.0%
jan 1, 1962
4.448
+0.507
12.86%
jan 1, 1963
3.647
-0.801
-18.01%
jan 1, 1964
4.898
+1.251
34.32%
jan 1, 1965
5.11
+0.212
4.34%
jan 1, 1966
5.104
-0.007
-0.13%
jan 1, 1967
6.54
+1.436
28.14%
jan 1, 1968
9.843
+3.303
50.5%
jan 1, 1969
9.623
-0.22
-2.23%
jan 1, 1970
11.629
+2.006
20.84%
jan 1, 1971
13.992
+2.363
20.32%
jan 1, 1972
15.148
+1.155
8.26%
jan 1, 1973
15.134
-0.013
-0.09%
jan 1, 1974
16.552
+1.418
9.37%
jan 1, 1975
20.53
+3.978
24.03%
jan 1, 1976
16.628
-3.902
-19.01%
jan 1, 1977
14.634
-1.994
-11.99%
jan 1, 1978
15.254
+0.62
4.24%
jan 1, 1979
15.26
+0.006
0.04%
jan 1, 1980
13.366
-1.894
-12.41%
jan 1, 1981
16.591
+3.225
24.13%
jan 1, 1982
24.89
+8.299
50.02%
jan 1, 1983
19.901
-4.989
-20.05%
jan 1, 1984
19.939
+0.039
0.19%
jan 1, 1985
19.384
-0.555
-2.78%
jan 1, 1986
17.192
-2.193
-11.31%
jan 1, 1987
11.705
-5.487
-31.91%
jan 1, 1988
14.665
+2.96
25.28%
jan 1, 1989
10.92
-3.745
-25.53%
jan 1, 1990
9.345
-1.575
-14.43%
jan 1, 1991
9.139
-0.206
-2.2%
jan 1, 1992
10.725
+1.586
17.36%
jan 1, 1993
10.753
+0.028
0.26%
jan 1, 1994
10.018
-0.735
-6.84%
jan 1, 1995
11.128
+1.111
11.09%
jan 1, 1996
13.62
+2.492
22.39%
jan 1, 1997
11.734
-1.886
-13.85%
jan 1, 1998
14.791
+3.056
26.05%
jan 1, 1999
15.516
+0.725
4.9%
jan 1, 2000
17.893
+2.378
15.32%
jan 1, 2001
20.461
+2.568
14.35%
jan 1, 2002
18.39
-2.071
-10.12%
jan 1, 2003
17.176
-1.214
-6.6%
jan 1, 2004
22.276
+5.1
29.69%
jan 1, 2005
21.625
-0.651
-2.92%
jan 1, 2006
24.486
+2.861
13.23%
jan 1, 2007
24.703
+0.217
0.88%
jan 1, 2008
29.251
+4.548
18.41%
jan 1, 2009
31.22
+1.968
6.73%
jan 1, 2010
22.061
-9.159
-29.34%
jan 1, 2011
22.041
-0.02
-0.09%
jan 1, 2012
25.505
+3.464
15.72%
jan 1, 2013
29.099
+3.594
14.09%
jan 1, 2014
27.542
-1.557
-5.35%
jan 1, 2015
24.803
-2.739
-9.94%
jan 1, 2016
23.723
-1.08
-4.36%
Ranking of countries by current statistics by years


Comments: